There have been plenty of changes in the U.S. rental market over the past decade,
but a review of U.S. rent statistics can help to provide a clear landscape of renting in the United States
today.
This article offers a deep insight into key statistics on how many people rent,
average rental costs, and how millennials and Gen Z fare in the current climate.
Key statistics
- Over 31% of people in the U.S. rent, with nearly 103
million renting in 2023 according to the latest official figures.
- 33.5% of the population were renting in 2014 compared to
34.9% in 2024.
- In the U.S., 17.2 million Millennials rent compared to
9.1 million baby boomers.
- Renters in the U.S. are typically younger than 35, with over 35% of
renter households headed by adults under 35, while only 10.7% of homeowners are in
this age group.
- Households earning $150,000 or more represent the largest single income
group among homeowners at 26%, compared to just 8.6% of renter households.
- Across the 50 states and the District of Columbia, renter-occupied homes
range from 25.7% in West Virginia up to 58.9% in the District of Columbia.
How many people rent in the U.S.?
Over 31% of people in the U.S. rent, with nearly 103 million renting in 2023,
according to the latest official figures.
The number of renters has slightly decreased over the previous two years, from
nearly 32% of the population in 2021 to 2022.
[1] U.S. Census. “Data Tables”. Accessed August 21, 2025. https://data.census.gov/table?q=total+number+of+renters&g=010XX00US&y=2014&d=ACS+1-Year+Supplemental+Estimates
Renters vs homeowners
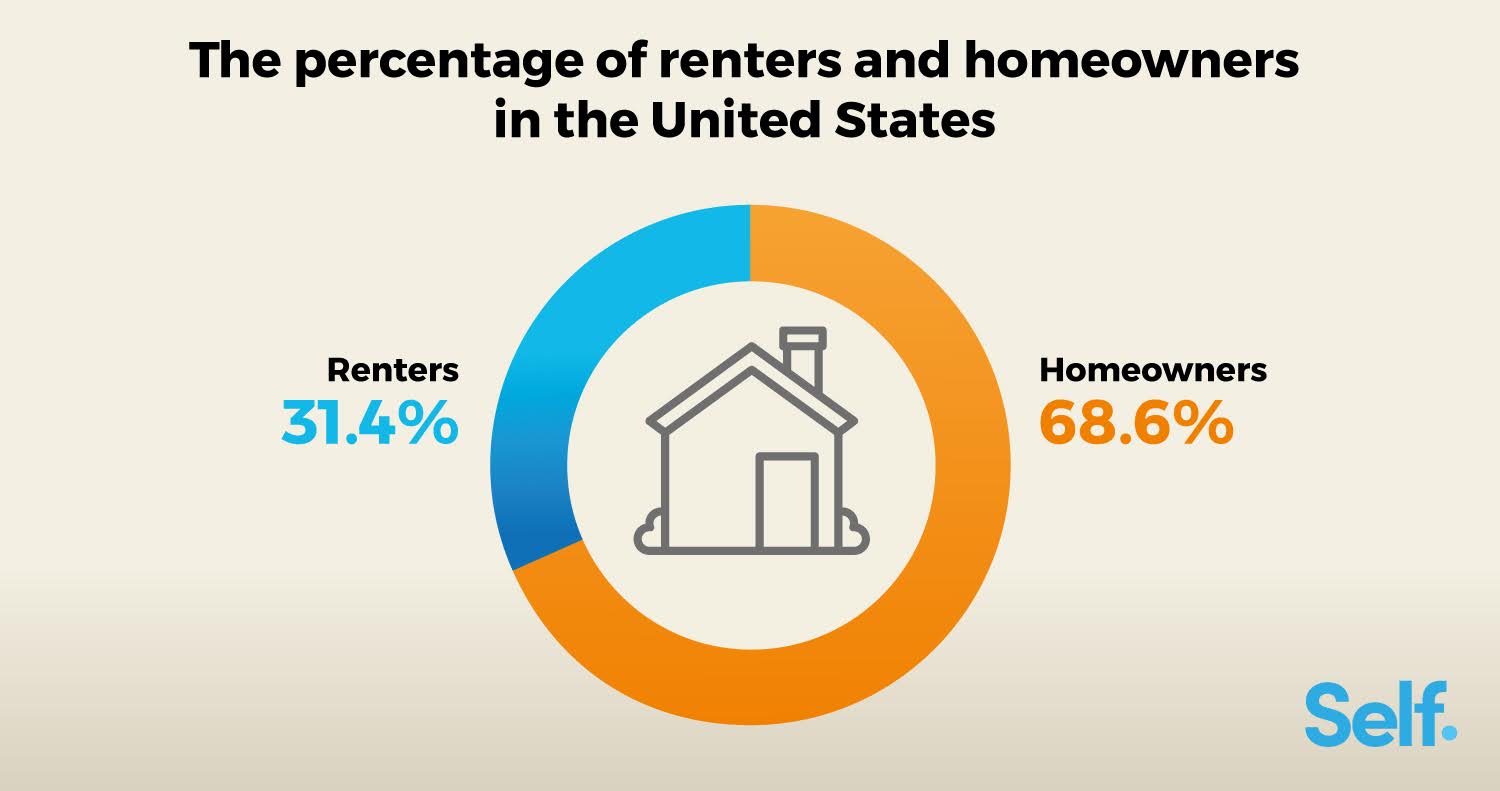
There were almost 103 million renters (31.4%) in the U.S. compared to 224 million
homeowners (68.6%), according to the official 2023 figures.
The Census 2024 figures show that rental figures are on the rise again; according to
the national data, 34.9% of homes are being leased.
[1] U.S. Census. “Data Tables”. Accessed August 21, 2025. https://data.census.gov/table?q=total+number+of+renters&g=010XX00US&y=2014&d=ACS+1-Year+Supplemental+Estimates
Renting a house or apartment offers significantly fewer initial costs and often
comes with fewer running costs as landlords typically pay for the maintenance of the premises.
The identity of renters and homeowners
Renters and homeowners tend to differ in age and household structure. Renters in the
U.S. are typically younger than 35, with 35.4% of renter households occupied by adults under 35, according to
the latest Census estimates based on householders. In contrast, only 10.7% of homeowners fall into this same age
group.
Households with incomes of $150,000 or more represent the largest income group among
owner-occupied homes at 26%. It’s a stark contrast to renters, with just 8.6% of rented homes generating
$150,000 and over. [1] U.S. Census. “Data Tables”. Accessed August 21, 2025. https://data.census.gov/table?q=total+number+of+renters&g=010XX00US&y=2014&d=ACS+1-Year+Supplemental+Estimates
According to the Zillow Observed Rent Index (ZORI) of all homes plus multifamily
time index, which tracks the typical asking rent for U.S. listings over time, rent prices have increased every
year since 2018 except in 2020. [3] Zippia. “Data Series: ZORI (Smoothed): All Homes Plus Multifamily Time Series ($) (Collected 10/31/2023)”. Accessed August 21, 2025. https://www.zillow.com/research/data/
Rent statistics by state in the U.S.
Across the 50 states and the District of Columbia, the highest number of
renter-occupied homes is the District of Columbia (58.9%), followed by New York (45.7%), and California (44.2%).
West Virginia has the highest percentage of owner-occupied housing units (74.3%),
followed by Maine (74.0%) and Michigan (72.9%).
Figures demonstrate the difference from one state to the next. Here are rent
statistics by state:
| State |
Occupied housing units |
Owner-occupied |
% owner-occupied |
Average household size of owner-occupied unit |
Renter-occupied |
% renter-occupied |
| State Alabama |
Occupied housing units 1,969,105 |
Owner-occupied 1,377,062 |
% owner-occupied 69.93% |
Average household size of owner-occupied unit 2.59 |
Renter-occupied 592,043 |
% renter-occupied 30.07% |
| State Alaska |
Occupied housing units 267,865 |
Owner-occupied 178,369 |
% owner-occupied 66.59% |
Average household size of owner-occupied unit 2.74 |
Renter-occupied 89,496 |
% renter-occupied 33.41% |
| State Arizona |
Occupied housing units 2,796,790 |
Owner-occupied 1,873,231 |
% owner-occupied 66.98% |
Average household size of owner-occupied unit 2.6 |
Renter-occupied 923,559 |
% renter-occupied 33.02% |
| State Arkansas |
Occupied housing units 1,189,160 |
Owner-occupied 786,534 |
% owner-occupied 66.14% |
Average household size of owner-occupied unit 2.56 |
Renter-occupied 402,626 |
% renter-occupied 33.86% |
| State California |
Occupied housing units 13,434,847 |
Owner-occupied 7,494,811 |
% owner-occupied 55.79% |
Average household size of owner-occupied unit 2.96 |
Renter-occupied 5,940,036 |
% renter-occupied 44.21% |
| State Colorado |
Occupied housing units 2,325,576 |
Owner-occupied 1,542,215 |
% owner-occupied 66.32% |
Average household size of owner-occupied unit 2.57 |
Renter-occupied 783,361 |
% renter-occupied 33.68% |
| State Connecticut |
Occupied housing units 1,420,170 |
Owner-occupied 939,912 |
% owner-occupied 66.18% |
Average household size of owner-occupied unit 2.62 |
Renter-occupied 480,258 |
% renter-occupied 33.82% |
| State Delaware |
Occupied housing units 396,209 |
Owner-occupied 286,340 |
% owner-occupied 72.27% |
Average household size of owner-occupied unit 2.54 |
Renter-occupied 109,869 |
% renter-occupied 27.73% |
| State District of Columbia |
Occupied housing units 321,556 |
Owner-occupied 132,288 |
% owner-occupied 41.14% |
Average household size of owner-occupied unit 2.21 |
Renter-occupied 189,268 |
% renter-occupied 58.86% |
| State Florida |
Occupied housing units 8,550,911 |
Owner-occupied 5,756,809 |
% owner-occupied 67.32% |
Average household size of owner-occupied unit 2.53 |
Renter-occupied 2,794,102 |
% renter-occupied 32.68% |
| State Georgia |
Occupied housing units 4,008,013 |
Owner-occupied 2,619,529 |
% owner-occupied 65.36% |
Average household size of owner-occupied unit 2.73 |
Renter-occupied 1,388,484 |
% renter-occupied 34.64% |
| State Hawaii |
Occupied housing units 488,991 |
Owner-occupied 305,869 |
% owner-occupied 62.55% |
Average household size of owner-occupied unit 2.99 |
Renter-occupied 183,122 |
% renter-occupied 37.45% |
| State Idaho |
Occupied housing units 693,821 |
Owner-occupied 502,140 |
% owner-occupied 72.37% |
Average household size of owner-occupied unit 2.74 |
Renter-occupied 191,681 |
% renter-occupied 27.63% |
| State Illinois |
Occupied housing units 5,001,904 |
Owner-occupied 3,343,034 |
% owner-occupied 66.84% |
Average household size of owner-occupied unit 2.63 |
Renter-occupied 1,658,870 |
% renter-occupied 33.16% |
| State Indiana |
Occupied housing units 2,681,537 |
Owner-occupied 1,886,485 |
% owner-occupied 70.35% |
Average household size of owner-occupied unit 2.6 |
Renter-occupied 795,052 |
% renter-occupied 29.65% |
| State Iowa |
Occupied housing units 1,303,763 |
Owner-occupied 932,618 |
% owner-occupied 71.53% |
Average household size of owner-occupied unit 2.5 |
Renter-occupied 371,145 |
% renter-occupied 28.47% |
| State Kansas |
Occupied housing units 1,160,715 |
Owner-occupied 776,311 |
% owner-occupied 66.88% |
Average household size of owner-occupied unit 2.6 |
Renter-occupied 384,404 |
% renter-occupied 33.12% |
| State Kentucky |
Occupied housing units 1,791,991 |
Owner-occupied 1,223,574 |
% owner-occupied 68.28% |
Average household size of owner-occupied unit 2.54 |
Renter-occupied 568,417 |
% renter-occupied 31.72% |
| State Louisiana |
Occupied housing units 1,783,168 |
Owner-occupied 1,200,407 |
% owner-occupied 67.32% |
Average household size of owner-occupied unit 2.6 |
Renter-occupied 582,761 |
% renter-occupied 32.68% |
| State Maine |
Occupied housing units 589,085 |
Owner-occupied 436,029 |
% owner-occupied 74.02% |
Average household size of owner-occupied unit 2.38 |
Renter-occupied 153,056 |
% renter-occupied 25.98% |
| State Maryland |
Occupied housing units 2,339,510 |
Owner-occupied 1,578,702 |
% owner-occupied 67.48% |
Average household size of owner-occupied unit 2.7 |
Renter-occupied 760,808 |
% renter-occupied 32.52% |
| State Massachusetts |
Occupied housing units 2,762,070 |
Owner-occupied 1,728,986 |
% owner-occupied 62.60% |
Average household size of owner-occupied unit 2.63 |
Renter-occupied 1,033,084 |
% renter-occupied 37.40% |
| State Michigan |
Occupied housing units 4,040,168 |
Owner-occupied 2,946,157 |
% owner-occupied 72.92% |
Average household size of owner-occupied unit 2.55 |
Renter-occupied 1,094,011 |
% renter-occupied 27.08% |
| State Minnesota |
Occupied housing units 2,282,967 |
Owner-occupied 1,652,534 |
% owner-occupied 72.39% |
Average household size of owner-occupied unit 2.6 |
Renter-occupied 630,433 |
% renter-occupied 27.61% |
| State Mississippi |
Occupied housing units 1,131,760 |
Owner-occupied 786,289 |
% owner-occupied 69.47% |
Average household size of owner-occupied unit 2.58 |
Renter-occupied 345,471 |
% renter-occupied 30.53% |
| State Missouri |
Occupied housing units 2,484,834 |
Owner-occupied 1,688,072 |
% owner-occupied 67.94% |
Average household size of owner-occupied unit 2.55 |
Renter-occupied 796,762 |
% renter-occupied 32.06% |
| State Montana |
Occupied housing units 452,683 |
Owner-occupied 314,266 |
% owner-occupied 69.42% |
Average household size of owner-occupied unit 2.48 |
Renter-occupied 138,417 |
% renter-occupied 30.58% |
| State Nebraska |
Occupied housing units 786,885 |
Owner-occupied 523,603 |
% owner-occupied 66.54% |
Average household size of owner-occupied unit 2.61 |
Renter-occupied 263,282 |
% renter-occupied 33.46% |
| State Nevada |
Occupied housing units 1,183,393 |
Owner-occupied 701,914 |
% owner-occupied 59.31% |
Average household size of owner-occupied unit 2.69 |
Renter-occupied 481,479 |
% renter-occupied 40.69% |
| State New Hampshire |
Occupied housing units 551,186 |
Owner-occupied 399,663 |
% owner-occupied 72.51% |
Average household size of owner-occupied unit 2.59 |
Renter-occupied 151,523 |
% renter-occupied 27.49% |
| State New Jersey |
Occupied housing units 3,478,355 |
Owner-occupied 2,215,482 |
% owner-occupied 63.69% |
Average household size of owner-occupied unit 2.74 |
Renter-occupied 1,262,873 |
% renter-occupied 36.31% |
| State New Mexico |
Occupied housing units 825,021 |
Owner-occupied 572,064 |
% owner-occupied 69.34% |
Average household size of owner-occupied unit 2.61 |
Renter-occupied 252,957 |
% renter-occupied 30.66% |
| State New York |
Occupied housing units 7,668,956 |
Owner-occupied 4,164,793 |
% owner-occupied 54.31% |
Average household size of owner-occupied unit 2.69 |
Renter-occupied 3,504,163 |
% renter-occupied 45.69% |
| State North Carolina |
Occupied housing units 4,186,924 |
Owner-occupied 2,778,672 |
% owner-occupied 66.37% |
Average household size of owner-occupied unit 2.55 |
Renter-occupied 1,408,252 |
% renter-occupied 33.63% |
| State North Dakota |
Occupied housing units 325,079 |
Owner-occupied 206,123 |
% owner-occupied 63.41% |
Average household size of owner-occupied unit 2.53 |
Renter-occupied 118,956 |
% renter-occupied 36.59% |
| State Ohio |
Occupied housing units 4,829,571 |
Owner-occupied 3,235,568 |
% owner-occupied 66.99% |
Average household size of owner-occupied unit 2.51 |
Renter-occupied 1,594,003 |
% renter-occupied 33.01% |
| State Oklahoma |
Occupied housing units 1,542,780 |
Owner-occupied 1,015,207 |
% owner-occupied 65.80% |
Average household size of owner-occupied unit 2.6 |
Renter-occupied 527,573 |
% renter-occupied 34.20% |
| State Oregon |
Occupied housing units 1,701,548 |
Owner-occupied 1,078,343 |
% owner-occupied 63.37% |
Average household size of owner-occupied unit 2.56 |
Renter-occupied 623,205 |
% renter-occupied 36.63% |
| State Pennsylvania |
Occupied housing units 5,235,339 |
Owner-occupied 3,629,624 |
% owner-occupied 69.33% |
Average household size of owner-occupied unit 2.53 |
Renter-occupied 1,605,715 |
% renter-occupied 30.67% |
| State Puerto Rico |
Occupied housing units 1,239,243 |
Owner-occupied 844,228 |
% owner-occupied 68.12% |
Average household size of owner-occupied unit 2.66 |
Renter-occupied 395,015 |
% renter-occupied 31.88% |
| State Rhode Island |
Occupied housing units 436,902 |
Owner-occupied 276,344 |
% owner-occupied 63.25% |
Average household size of owner-occupied unit 2.58 |
Renter-occupied 160,558 |
% renter-occupied 36.75% |
| State South Carolina |
Occupied housing units 2,070,390 |
Owner-occupied 1,478,858 |
% owner-occupied 71.43% |
Average household size of owner-occupied unit 2.51 |
Renter-occupied 591,532 |
% renter-occupied 28.57% |
| State South Dakota |
Occupied housing units 358,552 |
Owner-occupied 246,105 |
% owner-occupied 68.64% |
Average household size of owner-occupied unit 2.56 |
Renter-occupied 112,447 |
% renter-occupied 31.36% |
| State Tennessee |
Occupied housing units 2,768,743 |
Owner-occupied 1,855,793 |
% owner-occupied 67.03% |
Average household size of owner-occupied unit 2.55 |
Renter-occupied 912,950 |
% renter-occupied 32.97% |
| State Texas |
Occupied housing units 10,747,240 |
Owner-occupied 6,723,729 |
% owner-occupied 62.56% |
Average household size of owner-occupied unit 2.87 |
Renter-occupied 4,023,511 |
% renter-occupied 37.44% |
| State United States |
Occupied housing units 127,482,865 |
Owner-occupied 82,892,037 |
% owner-occupied 65.02% |
Average household size of owner-occupied unit 2.65 |
Renter-occupied 44,590,828 |
% renter-occupied 34.98% |
| State Utah |
Occupied housing units 1,094,896 |
Owner-occupied 773,345 |
% owner-occupied 70.63% |
Average household size of owner-occupied unit 3.17 |
Renter-occupied 321,551 |
% renter-occupied 29.37% |
| State Vermont |
Occupied housing units 269,466 |
Owner-occupied 196,162 |
% owner-occupied 72.80% |
Average household size of owner-occupied unit 2.43 |
Renter-occupied 73,304 |
% renter-occupied 27.20% |
| State Virginia |
Occupied housing units 3,326,260 |
Owner-occupied 2,234,492 |
% owner-occupied 67.18% |
Average household size of owner-occupied unit 2.64 |
Renter-occupied 1,091,768 |
% renter-occupied 32.82% |
| State Washington |
Occupied housing units 3,020,558 |
Owner-occupied 1,929,694 |
% owner-occupied 63.89% |
Average household size of owner-occupied unit 2.65 |
Renter-occupied 1,090,864 |
% renter-occupied 36.11% |
| State West Virginia |
Occupied housing units 721,448 |
Owner-occupied 536,082 |
% owner-occupied 74.31% |
Average household size of owner-occupied unit 2.48 |
Renter-occupied 185,366 |
% renter-occupied 25.69% |
| State Wisconsin |
Occupied housing units 2,446,028 |
Owner-occupied 1,660,505 |
% owner-occupied 67.89% |
Average household size of owner-occupied unit 2.5 |
Renter-occupied 785,523 |
% renter-occupied 32.11% |
| State Wyoming |
Occupied housing units 238,176 |
Owner-occupied 171,299 |
% owner-occupied 71.92% |
Average household size of owner-occupied unit 2.48 |
Renter-occupied 66,877 |
% renter-occupied 28.08% |
Source [1] U.S. Census. “Data Tables”. Accessed August 21, 2025. https://data.census.gov/table?q=total+number+of+renters&g=010XX00US&y=2014&d=ACS+1-Year+Supplemental+Estimates
Demographics of renters in the U.S
According to U.S. Census Bureau data, renters are more likely to be younger and
lower-income than homeowners. Among renter-occupied households, 35.4% are headed by someone under 35 years old,
and about 58% identify as White. [1] U.S. Census. “Data Tables”. Accessed August 21, 2025. https://data.census.gov/table?q=total+number+of+renters&g=010XX00US&y=2014&d=ACS+1-Year+Supplemental+Estimates Renters most often fall into income brackets between
$35,000 and $49,999, and 30% have some college education or a bachelor’s degree. [1] U.S. Census. “Data Tables”. Accessed August 21, 2025. https://data.census.gov/table?q=total+number+of+renters&g=010XX00US&y=2014&d=ACS+1-Year+Supplemental+Estimates
Renters and homeowners by household income
Let's take a closer look at renters' and homeowners' income.
| Household income (past 12 months) |
Occupied housing units |
Percent occupied housing units |
Owner-occupied housing units |
% |
Renter-occupied housing units |
% |
| Household income (past 12 months) Less than $5,000 |
Occupied housing units 4,470,961 |
Percent occupied housing units 3.4% |
Owner-occupied housing units 1,810,658 |
% 2.1% |
Renter-occupied housing units 2,660,303 |
% 5.9% |
| Household income (past 12 months) $5,000 to $9,999 |
Occupied housing units 2,648,593 |
Percent occupied housing units 2.0% |
Owner-occupied housing units 1,023,466 |
% 1.2% |
Renter-occupied housing units 1,625,127 |
% 3.6% |
| Household income (past 12 months) $10,000 to $14,999 |
Occupied housing units 4,835,372 |
Percent occupied housing units 3.7% |
Owner-occupied housing units 1,797,463 |
% 2.1% |
Renter-occupied housing units 3,037,909 |
% 6.7% |
| Household income (past 12 months) $15,000 to $19,999 |
Occupied housing units 4,199,024 |
Percent occupied housing units 3.2% |
Owner-occupied housing units 1,916,740 |
% 2.3% |
Renter-occupied housing units 2,282,284 |
% 5.0% |
| Household income (past 12 months) $20,000 to $24,999 |
Occupied housing units 4,613,942 |
Percent occupied housing units 3.6% |
Owner-occupied housing units 2,226,603 |
% 2.6% |
Renter-occupied housing units 2,387,339 |
% 5.3% |
| Household income (past 12 months) $25,000 to $34,999 |
Occupied housing units 9,425,048 |
Percent occupied housing units 7.3% |
Owner-occupied housing units 4,753,120 |
% 5.6% |
Renter-occupied housing units 4,671,928 |
% 10.3% |
| Household income (past 12 months) $35,000 to $49,999 |
Occupied housing units 13,834,348 |
Percent occupied housing units 10.7% |
Owner-occupied housing units 7,603,722 |
% 9.0% |
Renter-occupied housing units 6,230,626 |
% 13.8% |
| Household income (past 12 months) $50,000 to $74,999 |
Occupied housing units 21,096,082 |
Percent occupied housing units 16.2% |
Owner-occupied housing units 12,980,433 |
% 15.3% |
Renter-occupied housing units 8,115,649 |
% 17.9% |
| Household income (past 12 months) $75,000 to $99,999 |
Occupied housing units 16,650,769 |
Percent occupied housing units 12.8% |
Owner-occupied housing units 11,451,098 |
% 13.5% |
Renter-occupied housing units 5,199,671 |
% 11.5% |
| Household income (past 12 months) $100,000 to $149,999 |
Occupied housing units 21,945,002 |
Percent occupied housing units 16.9% |
Owner-occupied housing units 16,826,281 |
% 19.9% |
Renter-occupied housing units 5,118,721 |
% 11.3% |
| Household income (past 12 months) $150,000 or more |
Occupied housing units 26,151,787 |
Percent occupied housing units 20.1% |
Owner-occupied housing units 22,259,500 |
% 26.3% |
Renter-occupied housing units 3,892,287 |
% 8.6% |
Source [1] U.S. Census. “Data Tables”. Accessed August 21, 2025. https://data.census.gov/table?q=total+number+of+renters&g=010XX00US&y=2014&d=ACS+1-Year+Supplemental+Estimates
Renters and homeowners by age group
The majority of homeowners (21.2%) are aged between 55 and 64 years, while most
renters (35.4%) are younger than 35.
| Age of householder |
Occupied housing units |
Percent occupied housing units |
Owner-occupied housing units |
% |
Renter-occupied housing units |
% |
| Age of householder Under 35 years |
Occupied housing units 25,291,973 |
Percent occupied housing units 19.30% |
Owner-occupied housing units 9,128,548 |
% 10.70% |
Renter-occupied housing units 16,163,425 |
% 35.40% |
| Age of householder 35 to 44 years |
Occupied housing units 23,284,084 |
Percent occupied housing units 17.70% |
Owner-occupied housing units 14,218,785 |
% 16.60% |
Renter-occupied housing units 9,065,299 |
% 19.90% |
| Age of householder 45 to 54 years |
Occupied housing units 22,193,457 |
Percent occupied housing units 16.90% |
Owner-occupied housing units 15,516,267 |
% 18.10% |
Renter-occupied housing units 6,677,190 |
% 14.60% |
| Age of householder 55 to 64 years |
Occupied housing units 24,082,483 |
Percent occupied housing units 18.30% |
Owner-occupied housing units 18,179,439 |
% 21.20% |
Renter-occupied housing units 5,903,044 |
% 12.90% |
| Age of householder 65 to 74 years |
Occupied housing units 21,123,970 |
Percent occupied housing units 16.10% |
Owner-occupied housing units 16,701,958 |
% 19.50% |
Renter-occupied housing units 4,422,012 |
% 9.70% |
| Age of householder 75 to 84 years |
Occupied housing units 11,521,167 |
Percent occupied housing units 8.80% |
Owner-occupied housing units 9,190,843 |
% 10.70% |
Renter-occupied housing units 2,330,324 |
% 5.10% |
| Age of householder 85 years and over |
Occupied housing units 3,835,226 |
Percent occupied housing units 2.90% |
Owner-occupied housing units 2,750,029 |
% 3.20% |
Renter-occupied housing units 1,085,197 |
% 2.40% |
Source [1] U.S. Census. “Data Tables”. Accessed August 21, 2025. https://data.census.gov/table?q=total+number+of+renters&g=010XX00US&y=2014&d=ACS+1-Year+Supplemental+Estimates
When looking at how many millennials rent, statistics show that millennials are the
biggest population of renters; 2022 figures revealed that 17.2 million millennials are currently renting.
Here’s a look at the different generations and how many own or rent.
| Generation |
Renters (millions) |
Homeowners (millions) |
| Millennials |
17.2 |
18.2 |
| Gen X |
10.6 |
24.4 |
| Baby Boomer |
9.1 |
32.1 |
| Gen Z |
5.6 |
2.0 |
Source [4] RentCafe. “Millennials Make Historic Switch from Renter to Owner Majority”. Accessed August 21, 2025. https://www.rentcafe.com/blog/rental-market/market-snapshots/millennials-switch-renter-to-owner-majority/
According to RentCafe’s analysis of generational housing data, which used IPUMS CPS
microdata from the University of Minnesota’s Institute for Social Research and Data Innovation, millennials
remain the largest group of renters, with Gen Z continuing to face the greatest barriers to homeownership.
[4] RentCafe. “Millennials Make Historic Switch from Renter to Owner Majority”. Accessed August 21, 2025. https://www.rentcafe.com/blog/rental-market/market-snapshots/millennials-switch-renter-to-owner-majority/
As of 2022, Lakeland, FL, had the biggest percentage of millennial renters (60.8%).
[4] RentCafe. “Millennials Make Historic Switch from Renter to Owner Majority”. Accessed August 21, 2025. https://www.rentcafe.com/blog/rental-market/market-snapshots/millennials-switch-renter-to-owner-majority/
It’s no secret that millennials and Gen Z are finding it more difficult to get onto
the property ladder. There can be a number of reasons for this, with prices increasing and the economy changing.
The size of an average renting household by state
The average size of a renting household in the United States is 2.34, with the
highest average size being 2.72 in California and the lowest, 1.84 in Washington DC.
Take a look at the official data for the average household size below:
| State |
Total renter-occupied |
% renter occupied |
Average household size of renter-occupied unit |
| State Alabama |
Total renter-occupied 592,043 |
% renter occupied 30.07% |
Average household size of renter-occupied unit 2.29 |
| State Alaska |
Total renter-occupied 89,496 |
% renter occupied 33.41% |
Average household size of renter-occupied unit 2.4 |
| State Arizona |
Total renter-occupied 923,559 |
% renter occupied 33.02% |
Average household size of renter-occupied unit 2.41 |
| State Arkansas |
Total renter-occupied 402,626 |
% renter occupied 33.86% |
Average household size of renter-occupied unit 2.32 |
| State California |
Total renter-occupied 5,940,036 |
% renter occupied 44.21% |
Average household size of renter-occupied unit 2.72 |
| State Colorado |
Total renter-occupied 783,361 |
% renter occupied 33.68% |
Average household size of renter-occupied unit 2.19 |
| State Connecticut |
Total renter-occupied 480,258 |
% renter occupied 33.82% |
Average household size of renter-occupied unit 2.16 |
| State Delaware |
Total renter-occupied 109,869 |
% renter occupied 27.73% |
Average household size of renter-occupied unit 2.33 |
| State District of Columbia |
Total renter-occupied 189,268 |
% renter occupied 58.86% |
Average household size of renter-occupied unit 1.84 |
| State Florida |
Total renter-occupied 2,794,102 |
% renter occupied 32.68% |
Average household size of renter-occupied unit 2.46 |
| State Georgia |
Total renter-occupied 1,388,484 |
% renter occupied 34.64% |
Average household size of renter-occupied unit 2.46 |
| State Hawaii |
Total renter-occupied 183,122 |
% renter occupied 37.45% |
Average household size of renter-occupied unit 2.69 |
| State Idaho |
Total renter-occupied 191,681 |
% renter occupied 27.63% |
Average household size of renter-occupied unit 2.45 |
| State Illinois |
Total renter-occupied 1,658,870 |
% renter occupied 33.16% |
Average household size of renter-occupied unit 2.17 |
| State Indiana |
Total renter-occupied 795,052 |
% renter occupied 29.65% |
Average household size of renter-occupied unit 2.18 |
| State Iowa |
Total renter-occupied 371,145 |
% renter occupied 28.47% |
Average household size of renter-occupied unit 2.05 |
| State Kansas |
Total renter-occupied 384,404 |
% renter occupied 33.12% |
Average household size of renter-occupied unit 2.16 |
| State Kentucky |
Total renter-occupied 568,417 |
% renter occupied 31.72% |
Average household size of renter-occupied unit 2.26 |
| State Louisiana |
Total renter-occupied 582,761 |
% renter occupied 32.68% |
Average household size of renter-occupied unit 2.36 |
| State Maine |
Total renter-occupied 153,056 |
% renter occupied 25.98% |
Average household size of renter-occupied unit 1.96 |
| State Maryland |
Total renter-occupied 760,808 |
% renter occupied 32.52% |
Average household size of renter-occupied unit 2.34 |
| State Massachusetts |
Total renter-occupied 1,033,084 |
% renter occupied 37.40% |
Average household size of renter-occupied unit 2.14 |
| State Michigan |
Total renter-occupied 1,094,011 |
% renter occupied 27.08% |
Average household size of renter-occupied unit 2.13 |
| State Minnesota |
Total renter-occupied 630,433 |
% renter occupied 27.61% |
Average household size of renter-occupied unit 2.04 |
| State Mississippi |
Total renter-occupied 345,471 |
% renter occupied 30.53% |
Average household size of renter-occupied unit 2.4 |
| State Missouri |
Total renter-occupied 796,762 |
% renter occupied 32.06% |
Average household size of renter-occupied unit 2.13 |
| State Montana |
Total renter-occupied 138,417 |
% renter occupied 30.58% |
Average household size of renter-occupied unit 2.14 |
| State Nebraska |
Total renter-occupied 263,282 |
% renter occupied 33.46% |
Average household size of renter-occupied unit 2.09 |
| State Nevada |
Total renter-occupied 481,479 |
% renter occupied 40.69% |
Average household size of renter-occupied unit 2.53 |
| State New Hampshire |
Total renter-occupied 151,523 |
% renter occupied 27.49% |
Average household size of renter-occupied unit 2.05 |
| State New Jersey |
Total renter-occupied 1,262,873 |
% renter occupied 36.31% |
Average household size of renter-occupied unit 2.39 |
| State New Mexico |
Total renter-occupied 252,957 |
% renter occupied 30.66% |
Average household size of renter-occupied unit 2.29 |
| State New York |
Total renter-occupied 3,504,163 |
% renter occupied 45.69% |
Average household size of renter-occupied unit 2.31 |
| State North Carolina |
Total renter-occupied 1,408,252 |
% renter occupied 33.63% |
Average household size of renter-occupied unit 2.29 |
| State North Dakota |
Total renter-occupied 118,956 |
% renter occupied 36.59% |
Average household size of renter-occupied unit 1.94 |
| State Ohio |
Total renter-occupied 1,594,003 |
% renter occupied 33.01% |
Average household size of renter-occupied unit 2.12 |
| State Oklahoma |
Total renter-occupied 527,573 |
% renter occupied 34.20% |
Average household size of renter-occupied unit 2.35 |
| State Oregon |
Total renter-occupied 623,205 |
% renter occupied 36.63% |
Average household size of renter-occupied unit 2.22 |
| State Pennsylvania |
Total renter-occupied 1,605,715 |
% renter occupied 30.67% |
Average household size of renter-occupied unit 2.1 |
| State Puerto Rico |
Total renter-occupied 395,015 |
% renter occupied 31.88% |
Average household size of renter-occupied unit 2.45 |
| State Rhode Island |
Total renter-occupied 160,558 |
% renter occupied 36.75% |
Average household size of renter-occupied unit 2.1 |
| State South Carolina |
Total renter-occupied 591,532 |
% renter occupied 28.57% |
Average household size of renter-occupied unit 2.31 |
| State South Dakota |
Total renter-occupied 112,447 |
% renter occupied 31.36% |
Average household size of renter-occupied unit 2.11 |
| State Tennessee |
Total renter-occupied 912,950 |
% renter occupied 32.97% |
Average household size of renter-occupied unit 2.31 |
| State Texas |
Total renter-occupied 4,023,511 |
% renter occupied 37.44% |
Average household size of renter-occupied unit 2.42 |
| State United States |
Total renter-occupied 321,551 |
% renter occupied 29.37% |
Average household size of renter-occupied unit 2.58 |
| State Utah |
Total renter-occupied 73,304 |
% renter occupied 27.20% |
Average household size of renter-occupied unit 1.95 |
| State Vermont |
Total renter-occupied 1,091,768 |
% renter occupied 32.82% |
Average household size of renter-occupied unit 2.32 |
| State Virginia |
Total renter-occupied 1,090,864 |
% renter occupied 36.11% |
Average household size of renter-occupied unit 2.27 |
| State Washington |
Total renter-occupied 185,366 |
% renter occupied 25.69% |
Average household size of renter-occupied unit 2.18 |
| State Washington D.C. |
Total renter-occupied 189,268 |
% renter occupied 58.86% |
Average household size of renter-occupied unit 1.84 |
| State West Virginia |
Total renter-occupied 785,523 |
% renter occupied 32.11% |
Average household size of renter-occupied unit 2.03 |
| State Wisconsin |
Total renter-occupied 66,877 |
% renter occupied 28.08% |
Average household size of renter-occupied unit 2.1 |
| State Wyoming |
Total renter-occupied 592,043 |
% renter occupied 30.07% |
Average household size of renter-occupied unit 2.29 |
Source [1] U.S. Census. “Data Tables”. Accessed August 21, 2025. https://data.census.gov/table?q=total+number+of+renters&g=010XX00US&y=2014&d=ACS+1-Year+Supplemental+Estimates
Interestingly, statistics change between cities with different correlations and
patterns, this applies to more than house sizes.
The most common types of rental property
There’s no shortage of properties to rent with apartments, townhouses and even
opportunities for businesses to rent commercial property.
Here is a list of the different types of properties to rent:
- Duplexes
- Condo
- Townhouse
- Vacation Homes
- Apartments
- Commercial Properties
- Single Family Homes
- Getaway Homes
Rental properties by landlord type
A study conducted by Zillow in February 2023 asked questions to more than 1,000
people who own at least one property that they rent out. The results of the survey found the following.
For landlords who only rent out a single property, the most common unit type is a
single-family detached house (66%), followed by an apartment or condo in a smaller-sized building (10%).
Semi-detached houses are also most common for landlords who rent out multiple
properties (41%), with apartments or condos in small buildings (24%), and duplex or triplex apartments (23%)
also common.
[6] Zillow. “Typical U.S. Real Estate Investor”. Accessed on February 14, 2025. https://www.zillow.com/research/typical-real-estate-investor-32497/
| Type of property/properties rented out |
Landlords who rent out one property |
Landlords who rent out multiple properties |
| Type of property/properties rented out Apartment / Condo
in a smaller size building (fewer than 10 units) |
Landlords who rent out one property 10% |
Landlords who rent out multiple properties 24% |
| Type of property/properties rented out Apartment / Condo
in a medium size building (10-49 units) |
Landlords who rent out one property 5% |
Landlords who rent out multiple properties 16% |
| Type of property/properties rented out Apartment / Condo
in a larger size building (50 units or more) |
Landlords who rent out one property 4% |
Landlords who rent out multiple properties 12% |
| Type of property/properties rented out Duplex / Triplex
|
Landlords who rent out one property 6% |
Landlords who rent out multiple properties 23% |
| Type of property/properties rented out Manufactured /
mobile home |
Landlords who rent out one property 5% |
Landlords who rent out multiple properties 5% |
| Type of property/properties rented out Single-family
detached house |
Landlords who rent out one property 66% |
Landlords who rent out multiple properties 41% |
| Type of property/properties rented out Townhouse /
rowhouse |
Landlords who rent out one property 3% |
Landlords who rent out multiple properties 13% |
Source [6] Zillow. “Typical U.S. Real Estate Investor”. Accessed on February 14, 2025. https://www.zillow.com/research/typical-real-estate-investor-32497/
Lengths of rental leases
As of 2022, the most common length of rental is 12 months with 59.6% of rental
leases being this length. [7] Bureau of Labor Statistics. “Housing Leases in the U.S. Rental Market”. Accessed August 21, 2025. https://www.bls.gov/spotlight/2022/housing-leases-in-the-u-s-rental-market/home.htm
Aside from 12-month leases, the next most common lease length is 24-months, with
29.9% of other lease agreements being signed for 24 months.
| Other lease lengths(not including 12 months) |
Percentage of leases |
| 24 months |
29.9% |
| 13 months |
14.8% |
| 6 months |
12.4% |
| 15 months |
9.6% |
| 14 months |
7% |
| 10 months |
3.9% |
| Other length |
22.5% |
New tenants have increased by 76.4%, portraying renters moving home or people
recently joining the market as a renter. [7] Bureau of Labor Statistics. “Housing Leases in the U.S. Rental Market”. Accessed August 21, 2025. https://www.bls.gov/spotlight/2022/housing-leases-in-the-u-s-rental-market/home.htm
Rental vacancy rates
The rental vacancy rate has increased in 2025 with a rise of 0.5 percentage points
in the first quarter before decreasing by 0.1 percentage points in the second quarter.
[8] U.S. Census. “Quarterly Residential Vacancies and Homeownership”. Accessed August 21, 2025. https://www.census.gov/housing/hvs/files/currenthvspress.pdf
This means that there are more empty apartments and other rentals this year compared
to the previous year. There are fewer housing units and other types of rental properties occupied compared to
last year, but when dating back to 2018-2021, this year’s figures are not unusual.
Here’s a full take on the rental vacancy rate statistics:
Rental Vacancy Rate (percent)
| Year |
Q1 |
Q2 |
Q3 |
Q4 |
| 2025 |
7.1% |
7.0% |
- |
- |
| 2024 |
6.6% |
6.6% |
6.9% |
6.9% |
| 2023 |
6.4% |
6.3% |
6.6% |
6.6% |
| 2022 |
5.8% |
5.6% |
6% |
5.8% |
| 2021 |
6.8% |
6.2% |
5.8% |
5.6% |
| 2020 |
6.6% |
5.7% |
6.4% |
6.5% |
| 2019 |
7% |
6.8% |
6.8% |
6.4% |
| 2018 |
7% |
6.8% |
7.1% |
6.6% |
Sources