The Changing Value of $1
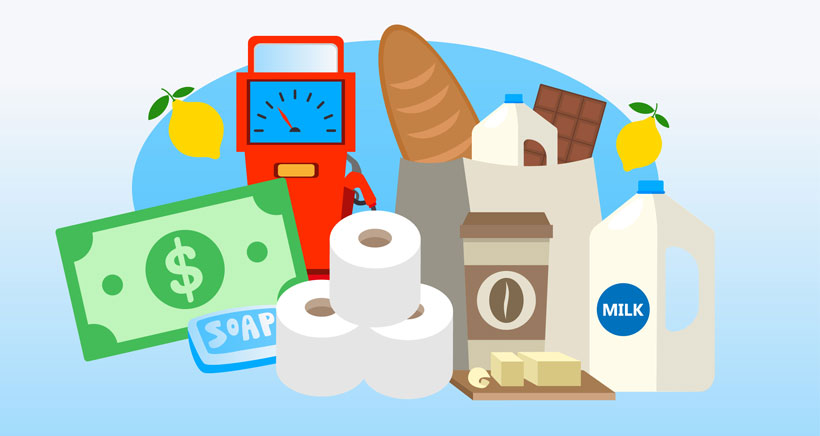
The one-dollar bill is one of the world’s most powerful pieces of paper. In 2021, due to the pandemic, inflation hit a 30-year high highlighting the changing power of the dollar for most. And while a single buck isn’t going to buy you your first home, or a brand new set of wheels, it is crucial for your weekly groceries or gassing up those wheels.
We wanted to know how the power of the dollar has changed over time so we analyzed historic pricing and cost of living data to show you what your $1 would get you at the grocery store in 2021, compared to every decade going back to 1900.
Key findings
- You could buy the most chocolate for $1 between 1910-1920 at 2.1 lb, in the 2020s you can expect 0.1 lb for the same amount.
- The 1920s were the most cost-effective decade for toilet paper where you could buy 30 rolls with $1, 2,400% more than in 2021.
- With $1 you could buy 125 lemons in the 1910s, the most in the 20th century. Since 2010, $1 can’t even buy two lemons.
- Between 1900-1910, one dollar could buy 14.3 gallons of gas, the best value in the 20th century, now the same amount would get you around 0.3 gallons.
- For milk, the best decade was the 1930s, where one dollar could buy 3.8 gallons.
The Value of $1 in 1900-1910 vs 2021
Overall, across the goods we analyzed, we found that one dollar purchased approximately 94% less in 2021 compared to 1900-1910.
Below is a breakdown of what one dollar could purchase in 1900-1910 compared to the 2020s.
| Item | Amount per dollar (1900-1910) | Amount per dollar (2020s) | Change (%) |
|---|---|---|---|
| Chocolate | 1.25 lb | 0.1 lb | -92% |
| Coffee | 3 lb | 0.18 lb | -94% |
| Butter | 4 lb | 0.26 lb | -93.50% |
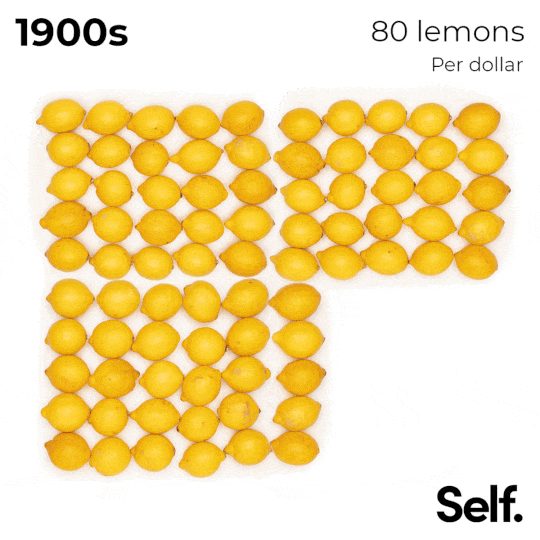
| Lemons | 80 lemons | 1.8 lemons | -97.75% |
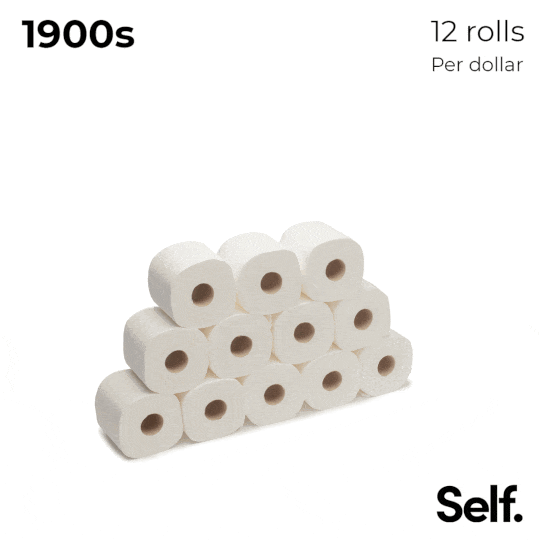
| Toilet paper | 12 rolls | 1.2 rolls | -90% |
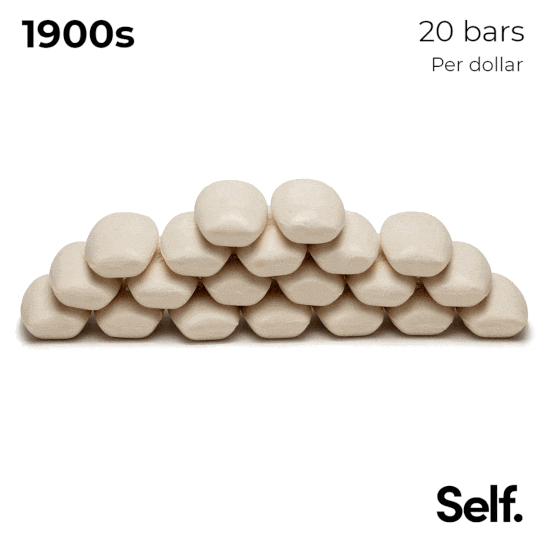
| Soap | 20 bars | 0.78 bar | -96.10% |
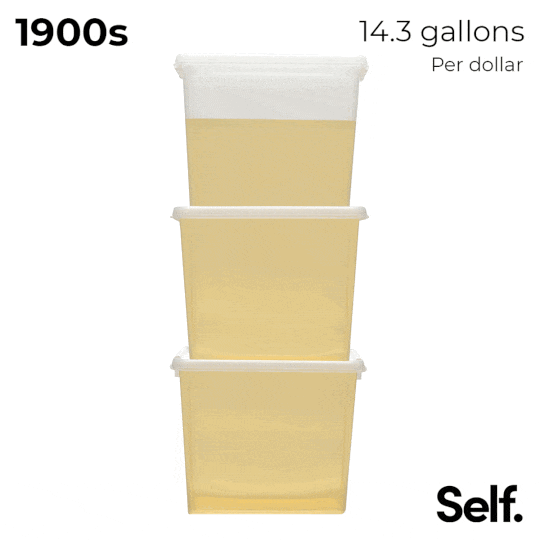
| Gasoline | 14.3 gallons | 0.3 gallon | -97.90% |
| Rice | 14.2 lb | 1.4 lb | -90.10% |
| Bread | 14.2 loaves | 0.5 loaves | -96.50% |
| Milk | 3.6 gallons | 0.3 gallon | -91.70% |
While our data goes back to 1900, it’s considered that the power of the dollar was actually at its peak in the 1910s after the creation of the Federal Reserve System in 1913, which was designed to alleviate the damage caused by financial crises, primarily brought on by the financial panic of 1907.
You can see the power of the 1910s dollar (1910-1920) in some grocery items in our analysis, for example, chocolate peaked in the decade at 2.1lb/$1 as did lemons at 125 lemons/$1.
However, some other items were at their most cost-effective in the 1920s during this period of financial security and before the financial crash in 1929. For example, a 1920s American could buy the most coffee (3.7 lb/$1) and toilet paper (30 rolls/$1) per dollar in this decade than any other.
Below is a breakdown of each item over time and how much one dollar would be able to purchase in each decade from the 1900s to today.
Chocolate
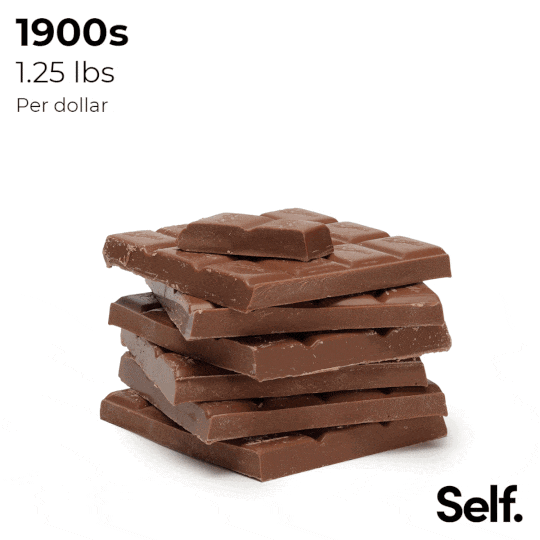
Between 1900-1910, $1 would get you an average of 1.25 lb of chocolate, this peaked higher at 2.1 lb in the next decade only to come crashing back down to 1.25 lb in the 1920s. Since the 2000s began, you can expect to get an average of 0.1 lb (1.6 oz) of chocolate for $1, and this is still true today.
| Decade | Chocolate (lb per $1) |
|---|---|
| 1900s | 1.25 |
| 1910s | 2.1 |
| 1920s | 1.25 |
| 1930s | 1.8 |
| 1940s | 1.8 |
| 1950s | 1.25 |
| 1960s | 1.25 |
| 1970s | 0.37 |
| 1980s | 0.27 |
| 1990s | 0.18 |
| 2000s | 0.1 |
| 2010s | 0.1 |
| 2020s | 0.1 |
Coffee
The average coffee lover drinks over 3 cups a day! How far can a dollar get you toward your caffeine fix now? To analyze this we looked at historic prices of coffee grounds over time. See the results in the GIF below.
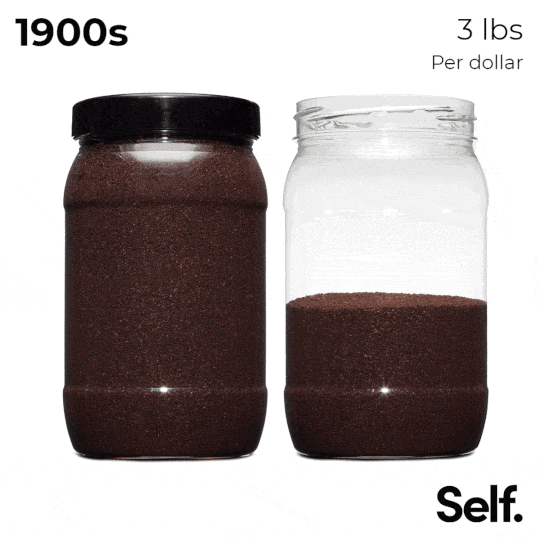
The most coffee you could get for your money was in the 1940s, at 4.1lb/$1.00, and now you can get an average of just 0.17lb for $1.
| Decade | Coffee (lb per $1) |
|---|---|
| 1900s | 3 |
| 1910s | 3 |
| 1920s | 3.7 |
| 1930s | 2.5 |
| 1940s | 4.1 |
| 1950s | 1.15 |
| 1960s | 1 |
| 1970s | 1 |
| 1980s | 0.5 |
| 1990s | 0.4 |
| 2000s | 0.34 |
| 2010s | 0.18 |
| 2020s | 0.18 |
Butter
Essential for your morning toast or home-baked goods, butter is a staple in our grocery shopping - but how many blocks could you get with one dollar over time? We’ve worked out the numbers below.
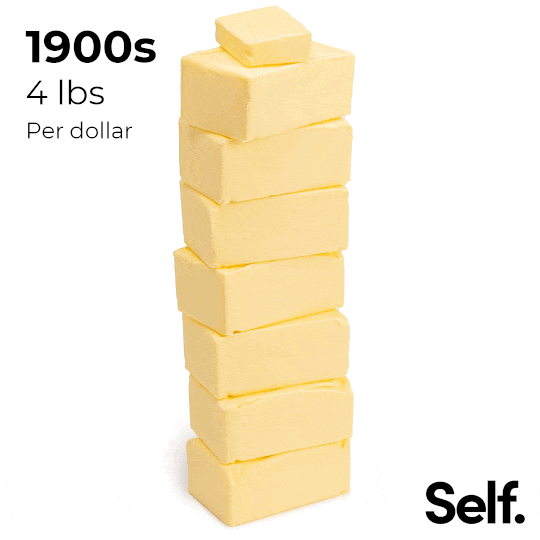
Between 1900-1910 you could get an average of 4lb butter per dollar, and it has decreased fairly consistently each decade since, although there was a slight rise in the 1930s, where $1 could buy 2.7 lb of butter - that’s enough for over 3 carrot cake recipes! The purchasing power of the dollar did increase in the 30s due to the stock market crash in 1929, so such fluctuations could be expected.
| Decade | Butter (lb per $1) |
|---|---|
| 1900s | 4 |
| 1910s | 3.2 |
| 1920s | 2.2 |
| 1930s | 2.7 |
| 1940s | 2.3 |
| 1950s | 1.4 |
| 1960s | 1.7 |
| 1970s | 1.4 |
| 1980s | 0.5 |
| 1990s | 0.5 |
| 2000s | 0.67 |
| 2010s | 0.18 |
| 2020s | 0.26 |
Lemons
It’s highly unlikely you would have spent a dollar on lemons in the 1910s because that single buck would’ve bought you around 125 individual lemons. This is up from 80 lemons in the decade before. Here’s how many lemons one dollar can buy the average person over time.
| Decade | Lemons (lemons per $1) |
|---|---|
| 1900s | 80 |
| 1910s | 125 |
| 1920s | 60 |
| 1930s | 60 |
| 1940s | 21 |
| 1950s | 24 |
| 1960s | 25 |
| 1970s | 12 |
| 1980s | 10 |
| 1990s | 10 |
| 2000s | 2.6 |
| 2010s | 1.8 |
| 2020s | 1.8 |
Toilet paper
Today, a dollar will buy you an average of 1.2 toilet paper rolls. Naturally, you can’t purchase 0.2 of a roll but in our visuals, we used this to show to the sheet just how much paper you can get for your money and it’s nowhere near the pyramid of 30 rolls you could have purchased in the 1920s.
Importantly, even if we analyzed the sheet count of toilet paper over time, we have no reliable way of understanding the change in sheet size over time. Toilet paper sheets have shrunk from around 4.5 inches to 4 in the last decade and this probably happened many other times since the 1900s. Ultimately, this means the dollar has bought many fewer wipes and cleanups as well as fewer sheets over time.
| Decade | Toilet paper (rolls per $1) |
|---|---|
| 1900s | 12 |
| 1910s | 28 |
| 1920s | 30 |
| 1930s | 15 |
| 1940s | 6.6 |
| 1950s | 8 |
| 1960s | 11 |
| 1970s | 6 |
| 1980s | 3.6 |
| 1990s | 3.4 |
| 2000s | 2.4 |
| 2010s | 2.6 |
| 2020s | 1.2 |
Soap
If you wanted to stay clean back in the 1900s, one dollar would get you 20 soap bars - that’s enough for one person for about two years worth of regular cleaning!
Interestingly, when looking at the price of soap bars over time, we can see that $1 would have got you around 12 bars in both the 1910s and 1950s. It’s possible that the two world wars and the 1929 stock market crash impacted this, but it is hard to say for certain.
| Decade | Soap (bars per $1) |
|---|---|
| 1900s | 20 |
| 1910s | 12.5 |
| 1920s | 15 |
| 1930s | 15 |
| 1940s | 7 |
| 1950s | 12 |
| 1960s | 9 |
| 1970s | 16 |
| 1980s | 2.5 |
| 1990s | 5 |
| 2000s | 1.3 |
| 2010s | 1.8 |
| 2020s | 0.78 |
Gasoline
In the 1900s you could get an average of 14.3 gallons for one dollar, fast forward to the 2020s and you can expect around 0.3 gallons per dollar. This is of course a nationwide average and would vary greatly in each state but here’s how much gas one dollar could’ve bought you over time.
| Decade | Gasoline (gallons per $1) |
|---|---|
| 1900s | 14.3 |
| 1910s | 6.6 |
| 1920s | 4.7 |
| 1930s | 5.2 |
| 1940s | 4.3 |
| 1950s | 4.3 |
| 1960s | 3 |
| 1970s | 1.75 |
| 1980s | 0.9 |
| 1990s | 0.87 |
| 2000s | 0.43 |
| 2010s | 0.3 |
| 2020s | 0.3 |
Rice
Between 1900-1910, you could buy an average of 14.2 lbs of rice for one dollar, that's over ten times more than a buck will get you now (1.4 lb/$1). Despite this, using an inflation calculator, we can see that one dollar in 1900 would be worth around $33 in 2021.
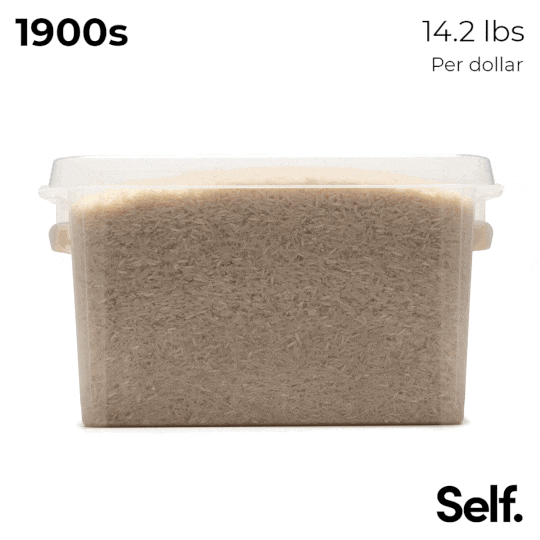
In the 1910s, 30s, and 40s, you could consistently buy over 11 lbs of rice with one dollar, except for the 1920s where historic grocery ads indicate you could only buy around 5.8 lbs for the same price.
| Decade | Rice (lb per $1) |
|---|---|
| 1900s | 14.2 |
| 1910s | 11.6 |
| 1920s | 5.8 |
| 1930s | 11.1 |
| 1940s | 11.1 |
| 1950s | 5.8 |
| 1960s | 5.2 |
| 1970s | 4.5 |
| 1980s | 2 |
| 1990s | 2 |
| 2000s | 1.9 |
| 2010s | 1.4 |
| 2020s | 1.4 |
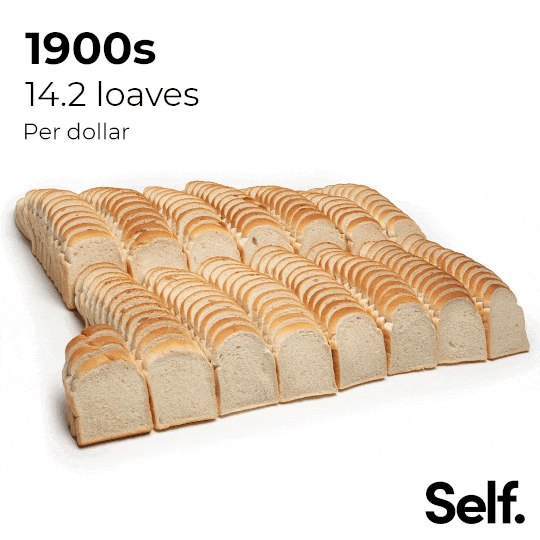
Bread
Most people are unlikely to need more than one or two loaves of bread, but in the 1900s and 1910s, you could buy over 14 with one dollar if you wanted. Since the 2010s, a dollar can buy an average of half a loaf of bread, up from an eighth of a loaf in the 2000s.
| Decade | Bread (loaves per $1) |
|---|---|
| 1900s | 14.2 |
| 1910s | 14.2 |
| 1920s | 10.7 |
| 1930s | 11.1 |
| 1940s | 10 |
| 1950s | 8.3 |
| 1960s | 4.5 |
| 1970s | 4 |
| 1980s | 2 |
| 1990s | 1.4 |
| 2000s | 0.8 |
| 2010s | 0.5 |
| 2020s | 0.5 |
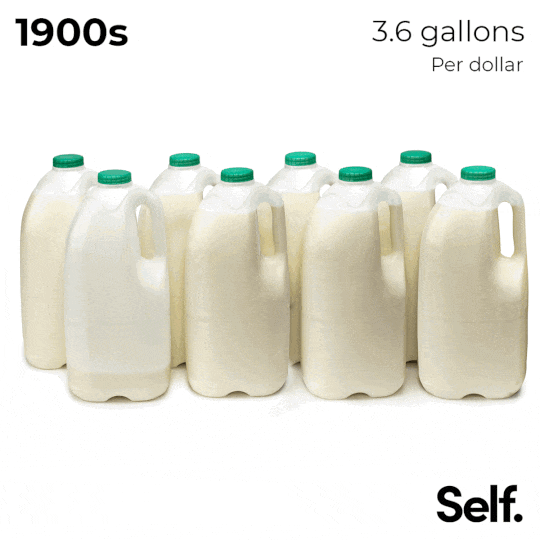
Milk
From 1900 until the 1930s, one dollar could buy 3.6 gallons of milk consistently, and then you could get even more (3.8 gallons) in the 30s for the same amount. After this, one dollar would buy less milk each decade as the cost of living increased leading to around 0.3 gallons from the 2000s onwards.
| Decade | Milk (gallons per $1) |
|---|---|
| 1900s | 3.6 |
| 1910s | 3.6 |
| 1920s | 3.6 |
| 1930s | 3.8 |
| 1940s | 1.92 |
| 1950s | 1.2 |
| 1960s | 1 |
| 1970s | 0.76 |
| 1980s | 0.45 |
| 1990s | 0.4 |
| 2000s | 0.31 |
| 2010s | 0.34 |
| 2020s | 0.3 |
Methodology
We took historic food and gasoline prices from a range of sources to plot the average price per decade per item focusing solely on how much one dollar could buy of that item.
Where possible average retail prices were used, however, the prices were dictated by what historical data exists. Where there was enough data across multiple years, we took a mean average price for the decade for the products analyzed. For some decades, data was only available for one year.
2021 prices were taken from Walmart’s online grocery prices on the 1st October 2021. Average costs were taken from the ten most popular products in that category based on the ‘Best selling’ filter functionality.
Data shows how much of a product you could have bought for $1 in that decade. Products like bread for example, were analyzed as if you could buy portions of a loaf to show exactly what $1 could purchase.
Also it should be noted that the data does not, and cannot, account for a societal shift in the size of non-weighted products like soap bars which are simply priced per bar and not in oz.
Sources
- Morris County Library, ‘Historic Prices’ (https://www.mclib.info/Research/Local-History-Genealogy/Historic-Prices) Accessed November 2021
- U.S Bureau of Labor Statistics, ‘Slicing through fruit price volatility’, December 2014 | Vol. 3 / No. 28 (https://www.bls.gov/opub/btn/volume-3/slicing-through-fruit-price-volatility.htm) Accessed November 2021
- The Food Timeline, ‘The "Hershey Bar Index’ (https://www.foodtimeline.org/foodfaq5.html#candybar) Accessed November 2021
- U.S. Energy Information Administration, ‘Total Energy: Monthly Energy Review’ (https://www.eia.gov/totalenergy/data/monthly/) Accessed November 2021
- U.S. News & World Report, ‘A Glimpse at Your Expenses 100 Years Ago’ (https://money.usnews.com/money/personal-finance/articles/2015/01/02/a-glimpse-at-your-expenses-100-years-ago) Accessed November 2021
- Bargains to Bounty,’Kroger: Stock Up Price on Scott Extra Soft Toilet Paper’ (https://www.bargainstobounty.com/2014/11/kroger-stock-price-scott-extra-soft-toilet-paper/) Accessed November 2021
- Value of a Dollar 1860 - 1999, via U.S. German Embassy (https://usa.usembassy.de/etexts/his/e_prices1.htm) Accessed November 2021
- Statista, ‘Retail price of white rice (long grain, uncooked) in the United States from 1995 to 2020’ (https://www.statista.com/statistics/236628/retail-price-of-white-rice-in-the-united-states/) Accessed November 2021
- U.S. Bureau of Labor Statistics, ‘RETAIL PRICES 1913 TO DECEMBER, 1920’ (https://fraser.stlouisfed.org/files/docs/publications/bls/bls_0300_1922.pdf) Accessed November 2021
- The People History, ‘Comparison Of Prices Over 90 Years’ (https://www.thepeoplehistory.com/70yearsofpricechange.html) Accessed November 2021
- Statista, Retail price of butter (salted, grade AA, stick) in the United States from 1995 to 2011 (https://www.statista.com/statistics/236858/retail-price-of-butter-in-the-united-states/) Accessed November 2021
- Taste of Home, ‘Here’s the Price of Milk the Year You Were Born’ (https://www.tasteofhome.com/article/heres-the-price-of-milk-the-year-you-were-born/) Accessed November 2021
- AAA Gas Prices, ‘NATIONAL AVERAGE GAS PRICES’ (https://gasprices.aaa.com/) Accessed November 2021
- Walmart Groceries (https://www.walmart.com/browse/shop-by-brand/food-grocery/3734780_7455738) Accessed October 2021