Homelessness & Empty Homes - Trends & Analysis
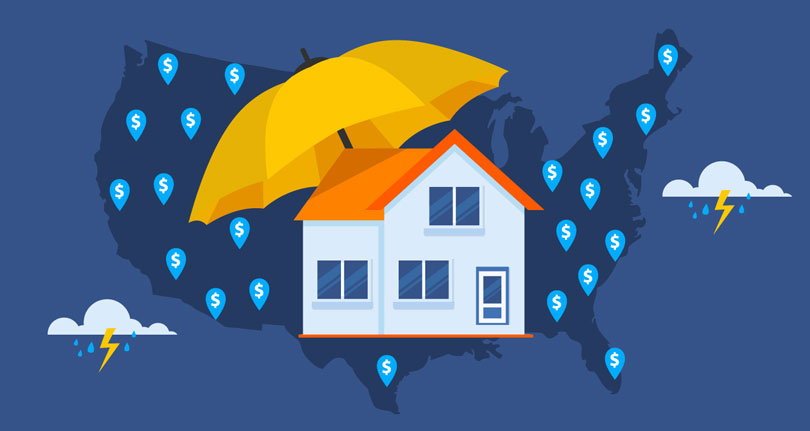
Homelessness and vacant homes are a real concern across the U.S., costing local and federal governments and agencies billions of dollars each year in lost tax revenues and social spending.
The latest figures show that homelessness in the U.S. increased by 12.4% between 2022 and 2023. In terms of the number of people, there were at least 640,894 people experiencing homelessness nationwide on any single night in 2023. [1] HUD Exchange, “AHAR Reports” https://www.huduser.gov/portal/datasets/ahar.html
These figures are made worse when viewing them alongside the number of vacant properties, what this analysis refers to as ‘empty homes’. In 2023, there were over 14.8 million empty homes in the U.S. leaving, on average, 11.62% of all housing units per state in the U.S. vacant as of the latest figures in 2023. [2] United States Census Bureau, American Community Survey, DP04 SELECTED HOUSING CHARACTERISTICS https://data.census.gov/table?t=Housing+Units:Occupancy+Characteristics&g=0100000US$0400000&tid=ACSDP5Y2021.DP04
Key findings
- There is an average of 45.9 empty homes in the U.S. for each person experiencing homelessness.
- Mississippi has the highest ratio of vacant homes to people experiencing homelessness, with approximately 204.7 vacant homes for every individual.
- In 2023, an estimated 640,894 people were confirmed as experiencing homelessness in the U.S. on an average night.
- Between 2010 and 2023 there was a 6.5% decrease in the number of empty properties in the U.S., with 2023 seeing the lowest figure.
- In 2023, California recorded the most homeless people with 181,399 people experiencing homelessness, that’s more than 14 times the average across all other states (12,818).
- Homelessness nationally has increased 12.5% from 2020 to 2023.
- North Dakota saw the highest state percentage increase of unoccupied homes from 2010 to 2023 by 37.5%.
- Vermont has seen the biggest increase in homelessness between 2010 and 2023, up by 170%, increasing from 1,220 in 2010 to 3,295 in 2023.
What is an ‘empty home’?
An empty home is what the government refers to as a ‘vacant housing unit’, which, for whatever reason, is not occupied by a citizen. This can include vacation homes but also properties that have sold but are not occupied. This is according to the United States Census Bureau, where all property data for this analysis was collected. You can see all exceptions and inclusions to property types in the official government definition. [3] United States Census Bureau, “Definitions and Explanations” https://www.census.gov/housing/hvs/definitions.pdf
The research process
This study uses historical data taken from the United States Census Bureau’s ‘American Community Survey’ up to 2023, [4] United States Census Bureau, “American Community Survey (ACS)” https://www.census.gov/programs-surveys/acs looking at occupied properties, as well as the National Housing and Urban Development Exchange’s analysis on people experiencing homelessness up to 2023. [1] HUD Exchange, “AHAR Reports” https://www.huduser.gov/portal/datasets/ahar.html
The map below shows:
- Number of homeless people per state
- Number of empty properties per state
- The ratio of homelessness and vacant properties per state
- How this has changed per state since 2010
Use the map below to click through each year to see how each state compares, as well as how the actual numbers of empty homes and homelessness have changed since 2010.
Homelessness figures in the U.S. since 2010
| Year |
Homelessness |
| 2010 |
620,161 |
| 2011 |
608,068 |
| 2012 |
605,311 |
| 2013 |
573,303 |
| 2014 |
558,899 |
| 2015 |
547,378 |
| 2016 |
532,183 |
| 2017 |
515,692 |
| 2018 |
537,114 |
| 2019 |
555,672 |
| 2020 |
569,334 |
| 2021 |
371,616 |
| 2022 |
569,917 |
| 2023 |
640,894 |
2021 figures lower due to less reporting during COVID-19 pandemic

2021 data reviewed only sheltered homelessness, therefore those homeless without shelter were not counted. This was due to fears of infection spreading during the COVID-19 pandemic.
The data shows that between 2010 and 2023, there has been a 3.3% increase in the number of people experiencing homelessness in the U.S. More recent years have been particularly turbulent due to the economy being rocked by the COVID-19 pandemic and in 2022/2023 with rising inflation rates. [1] HUD Exchange, “AHAR Reports” https://www.huduser.gov/portal/datasets/ahar.html
Using the latest population estimates, this would mean 0.2% of the U.S. population was experiencing homelessness in 2023. [1] HUD Exchange, “AHAR Reports” https://www.huduser.gov/portal/datasets/ahar.html [5] Census, “U.S. Population Trends Return to Pre-Pandemic Norms as More States Gain Population” https://www.census.gov/newsroom/press-releases/2023/population-trends-return-to-pre-pandemic-norms.html People can become homeless for a variety of reasons, however, some of the common reasons include not having an income high enough to afford to rent or buy a home and a lack of affordable housing in the area. [6] Endhomelessness.org, “What Causes Homelessness?” https://endhomelessness.org/homelessness-in-america/what-causes-homelessness/
States where homelessness is at its worst
In 2023, California had a homeless population that was 14 times larger than the national state average, with 181,399, compared to the state average of 12,818. California is the second most expensive state to purchase a home (second only to Hawaii) in the U.S. as of January 2024, therefore moving from homelessness to homeownership could be a big challenge for residents of The Golden State.
The five states with the highest numbers of people experiencing homelessness as of 2023 are:
- California (181,399)
- New York (103,200)
- Florida (30,756)
- Washington (28,036)
- Texas (27,377)
Source [1] HUD Exchange, “AHAR Reports” https://www.huduser.gov/portal/datasets/ahar.html
States where homelessness has increased the most
Vermont has seen the biggest increase in homelessness of 170%, between 2010 and 2023, increasing from 1,220 in 2010 to 3,295 in 2023. A 2024 report found that rising rents and home costs have disproportionately impacted low- and middle-income residents of Vermont, alongside “inadequate housing quality” which have all influenced Vermont’s rising issues with homelessness. [7] Housing and Homelessness Alliance of Vermont, “2025 Legislative Priorities - Vermont Coalition to End Homelessness” https://helpingtohousevt.org/advocacy/
The five states where homelessness has increased the most from 2010 to 2023 are:
- Vermont (170%)
- Maine (79%)
- South Dakota (75.4%)
- New York (57.3%)
- New Hampshire (55%)
Source [1] HUD Exchange, “AHAR Reports” https://www.huduser.gov/portal/datasets/ahar.html
States with the highest number of empty homes
Nationally, empty homes have decreased from just under 16 million (15,849,825) in 2010 to 14,815,466 in 2023 (the latest official data available), a 6.5% decrease.
Florida has the highest number of vacant properties, at 1,531,445 followed by Texas with 1,143,568 empty homes.
The five states with the highest number of vacant properties are:
- Florida (1,531,445)
- Texas (1,143,568)
- California (1,097,836)
- New York (870,580)
- North Carolina (628,271)
Source [2] United States Census Bureau, American Community Survey, DP04 SELECTED HOUSING CHARACTERISTICS https://data.census.gov/table?t=Housing+Units:Occupancy+Characteristics&g=0100000US$0400000&tid=ACSDP5Y2021.DP04
States that have seen the biggest increase in empty homes
North Dakota has the highest percentage change in the number of unoccupied homes from 2010 to 2023 at 37.5%. However, the Peace Garden State has one of the lowest homeless populations of any state with 784 people experiencing homelessness in 2023, which is 12,034 people less than the state average (12,818).
The states that have seen the highest increase in the number of empty homes from 2010 to 2023 are:
- North Dakota (37.5%)
- Alaska (18.4%)
- Louisiana (15.6%)
- Mississippi (15.5%)
- Iowa (10.8%)
Source [2] United States Census Bureau, American Community Survey, DP04 SELECTED HOUSING CHARACTERISTICS https://data.census.gov/table?t=Housing+Units:Occupancy+Characteristics&g=0100000US$0400000&tid=ACSDP5Y2021.DP04
Empty homes compared to people experiencing homelessness
Comparing the datasets reveals that there is an average of 45.9 vacant homes per homeless person in the U.S. in 2023, this has increased from 41 in 2010.
Mississippi has the highest number of vacant homes to homeless people, with 204.7 vacant homes per one person experiencing homelessness, which is 346% higher than the U.S. average. [1] HUD Exchange, “AHAR Reports” https://www.huduser.gov/portal/datasets/ahar.html [2] United States Census Bureau, American Community Survey, DP04 SELECTED HOUSING CHARACTERISTICS https://data.census.gov/table?t=Housing+Units:Occupancy+Characteristics&g=0100000US$0400000&tid=ACSDP5Y2021.DP04
Methodology:
The research reviewed the number of occupied and unoccupied properties per state for each year between 2010 and 2023 (most recent available data) using the United States Census Bureau’s ‘American Community Survey.
The study also collected the historical data for homelessness from 2010 to 2023 using the HUD Exchange’s annual reports.
The ratios are then calculated by dividing the number of vacant properties in each state by the number of people experiencing homelessness in each state for a given year.
Sources