Millennial Homeownership Statistics
Homeownership in the United States has undergone significant change in recent years, with millennials emerging as the largest generation in the country with the potential to become homeowners. But this demographic is also struggling the most to get onto the property ladder (when compared to previous generations).
Drawing upon data from sources like the U.S. Census Bureau, this article explores the current state of millennial homeownership, delving into key trends, challenges, and opportunities for this demographic.
Key statistics
- Just over half (51.4%) of millennials own their own home as of 2022, this is the first time that millennials have become majority homeowners rather than renters.
- 78% of millennials dream of owning a home but claim that financial constraints and affordability issues prevent them from doing so.
- Current economic conditions and housing market problems are holding back 59% of millennials from buying a home.
- Millennial homeownership varies depending on location. Millennials generally own more homes in smaller markets such as those in the Midwest and Great Lakes regions.
- Midland, Texas has the highest rate of millennial homeownership at 82%, while Salinas, California is the lowest at 18.9% as of 2022.
- As the largest generation, millennials also make up the majority of the renting population in the U.S., with 17.2 million renters.
- A quarter (25%) of millennial renters claim they will have no choice but to rent forever because they can't save the funds for a down payment.
Who are millennial homeowners?
The definition of millennials used in this analysis refers to people born between 1981 and 1996 who are aged between 27 and 42 years old at the time of writing.
How many millennials own their own home?
According to 2019 U.S. Census data, millennials overtook Baby Boomers and Generation X in 2019 as the largest generation, with 72 million millennials, compared to 71 million Baby Boomers, and 65 million people making up Generation X. [1] U.S. Census - National Population by Characteristic https://www.census.gov/data/datasets/time-series/demo/popest/2010s-national-detail.html
This makes the millennial market a highly desirable one for mortgage lenders and homebuilders to attract. That said, the millennial generation grew up in between two rather large global crises – with 9/11 in 2001, and the 2007-2008 housing crisis, preventing some from getting secure jobs after graduating.
Millennial homeownership is lower than that of previous generations
According to the latest data from 2022, homeownership starts to dip more with every passing generation. An analysis of IPUMS data from the nation’s 110 largest metros (with populations of 500,000 or more) found that 77.9% of Baby Boomers own their own home, alongside 69.7% of Generation X, and 51.4% of millennials. This is the first time millennials have crossed the threshold into majority homeowners, with more people owning than renting. Gen Z has the lowest homeownership rate overall at 26.3%.
| Generation |
Percentage owning their own home |
| Baby Boomers |
77.9% |
| Gen X |
69.7% |
| Millennial |
51.4% |
| Gen Z |
26.3% |
Source [2] Rent Cafe - Millennials Make Historic Switch from Renter Majority to Owner Majority https://www.rentcafe.com/blog/rental-market/market-snapshots/millennials-switch-renter-to-owner-majority/
So why is this happening? A driving force is millennials' aspirations and housing needs. Factors include being able to live in a place where one actually wants to live, medical and student debts, obtaining a good credit score and ample savings, stagnant wages, the effect COVID-19 has had on the way we all live and work, and the rising cost of housing.
How has homeownership changed over time?
According to the Rental Housing Journal, millennial homeownership may be trailing other generations, and may have also faced problems with the housing market, financial crises' and saving for a deposit, but regardless, a very important milestone has been reached, with 52% of millennials now owning their own home in the U.S. [3] Rental Housing Journal - More Than 50% of Millennials now Own Homes https://rentalhousingjournal.com/more-than-50-percent-of-millennials-now-own-homes/
Although this is good news, millennials still lag behind generations like Generation X and Baby Boomers when it comes to owning their own property. Millennials have had to endure a much tougher journey to become homeowners than previous generations.
In the past, millennials coming out of college had a challenge on their hands to secure jobs due to the Great Recession of 2007-2008, which became more challenging to their career intentions. This also caused many millennials to postpone major life events like marriage, homeownership, and having children due to the post-recession global economic recovery. Many millennials continued to rent throughout this period, as prices were high and demand for housing outstripped supply.
A lack of available housing for millennial buyers
Another problem that millennials have faced is that there just aren't enough homes to accommodate the 72.1 million of them. Following the 2007-2008 financial crisis, homebuilders cut back on producing more homes for people to buy, which created a shortage of available housing.
Since coming out of the Coronavirus pandemic, millennials now face a new set of challenges – higher mortgage rates, higher inflation, rent hikes, and higher borrowing rates for other credit like auto and credit cards. Homebuilders who were constructing homes as profits reached new highs during the pandemic have now decided to cut back for fear of another global recession.
In a speech given in September 2022, U.S. Federal Reserve Board Chairman Jerome Powell said that the U.S. Housing market will have to undergo a 'correction', as many Americans can't afford a home due to 'red hot' prices. He also said: "For the longer term what we need is supply and demand to get better aligned so housing prices go up at a reasonable level, at a reasonable pace and people can afford houses again.” [4] Reuters - Fed’s Powell: U.S. Housing Market Headed for ‘Correction’ https://www.reuters.com/markets/us/feds-powell-us-housing-market-headed-correction-2022-09-21/#:~:text=Sept 21 (Reuters) - Federal,of reach for many Americans]
Homeowners in other generations
Homeownership varies by generation due to the country and the world’s changing financial landscape over time. Let’s take a look at the difference in homeownership across other generations.
Baby Boomers
According to the National Association of Realtors, as of late March 2023, Baby Boomers held the largest share of the home buyer market.
A 2022 survey of 4,854 recent home buyers conducted by the association found that the share of younger Boomers (58 – 67 years old), combined with older Boomers (68 – 76 years old), rose to 39% in 2022. This is up from 29% in 2021. Millennials have collectively been the leading group of homebuyers since 2014, but their share has fallen from 43% in 2021 to 28% in 2022. [5] NAR Realtor - Home Buyers and Sellers Generational Trends https://www.nar.realtor/research-and-statistics/research-reports/home-buyer-and-seller-generational-trends
Many Baby Boomers are buying second or third properties, with equity that is built up in previous homes that can support their next move and purchase. This helps them to obtain a mortgage much easier if needed, and home purchases can be made later in life.
Generation X
Just under a quarter (24%) of total buyers in the housebuying market are in Generation X (those between 43 and 58 years old). There are 65.2 million people in Generation X currently living in the U.S. as of the 2019 Census.
Like millennials, Generation X was impacted by the financial crises and economic downturn of the 2000s, which makes them conservative when compared to other homebuyers. A research study by the Pew Research Center for example found that the median wealth of Generation X households declined by 38% during the recession (in comparison to Baby Boomers who lost 26, and the Silent Generation who lost 14%.) However, this study also found that Gen Xers’ median net worth recovered by 115% between 2010 and 2016. [6] Pew Research - Gen X Rebounds as the Only Generation to Recover the Wealth Lost After the Housing Crash https://www.pewresearch.org/short-reads/2018/07/23/gen-x-rebounds-as-the-only-generation-to-recover-the-wealth-lost-after-the-housing-crash/
Generation Z
Those in Generation Z (aged 18-24), have a very small share of the housebuying market, at just 4%. This is however an increase from 2% as of 2021. 30% of Generation Z buyers moved straight into homeownership from a family home. Many rely on family funds to help them save for a down payment on a home. [5] NAR Realtor - Home Buyers and Sellers Generational Trends https://www.nar.realtor/research-and-statistics/research-reports/home-buyer-and-seller-generational-trends
Change in median wage and median house prices over time
House price ratios in the U.S. fluctuated in the 10 years between 2012 and 2022. This ratio measures how affordable housing is in the country and is calculated by dividing a nominal house price by the nominal disposable income per head. 2015 is set as a base year when the index was 100.
This index score has now grown since the first half of 2022 to 135.2, which indicates that housing prices have overtaken income growth by more than 35% since 2015. This has been caused by wages stagnating, but house prices continuing to increase since 2014, which in turn makes it a struggle for people to afford a home. [7] Statista - Quarterly House Price-to-Income Ratio https://www.statista.com/statistics/591435/house-price-to-income-ratio-usa/
An increasing house price-to-income ratio
Between 2019 and 2021, the house price-to-income ratio went from 4.7 to 5.4. To put this into perspective, this is more than twice the recommended ratio of 2.6, causing a home to cost over five times more than what an average American earns in a year. In 2021, to afford a home, Americans needed an average income of $144,192 — but the current median household income was $69,178. [8] Real Estate Witch - House Price-to-Income Ratio https://www.realestatewitch.com/house-price-to-income-ratio-2021/
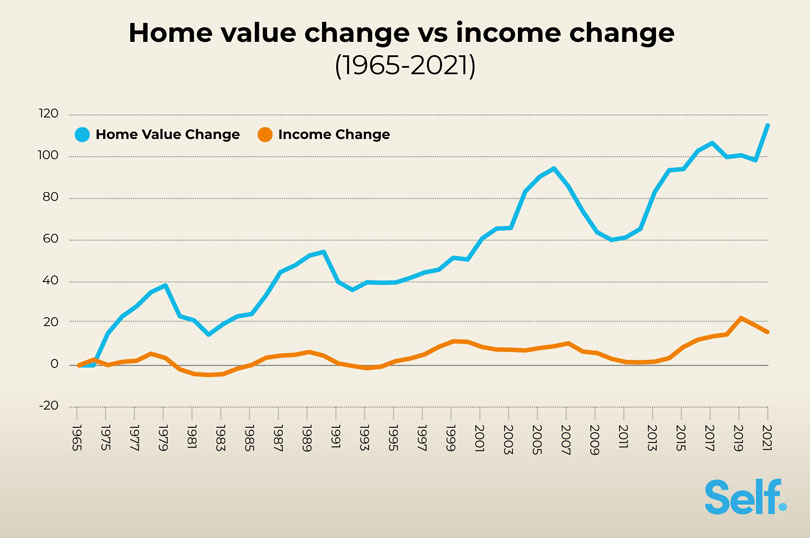
The dream of owning one's own home and a good income from a steady job has fallen flat, and become less of an achievable goal for younger generations as time has passed. This is because, from 1965 to 2021, home prices have increased 7.6x faster than income, as the table below indicates.
However, this data is from 2021, and with the higher interest rates we have seen in 2022 and 2023, the gap between home values and median incomes could have widened even further.
Source [8] Real Estate Witch - House Price-to-Income Ratio https://www.realestatewitch.com/house-price-to-income-ratio-2021/
A property that was worth $171,942 back in 1965 was worth $374,900 in 2021, which is a price increase of 118%. Despite this rise, median household income has only increased by 15% since 1965.
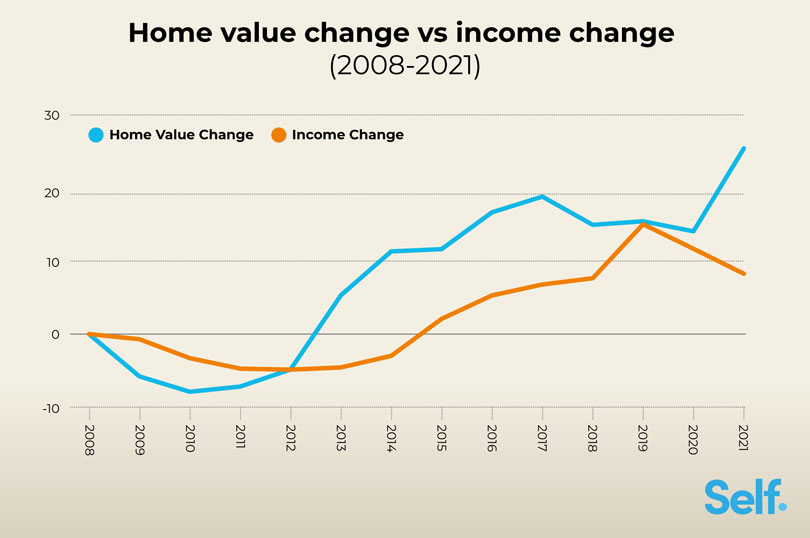
To compound this, since the 2007-2008 market crash and recession, the average house-price-to-income ratio has worsened, with housing prices steadily increasing over three times faster than income since 2008. The table below indicates house price growth vs. income growth between 2008 to 2021.
Source [8] Real Estate Witch - House Price-to-Income Ratio https://www.realestatewitch.com/house-price-to-income-ratio-2021/
House price-to-income ratio by state
House price-to-income ratios also vary by state, which can make it more difficult to buy a home in some states compared to others.
The analysis below takes the median house price and median household income in each state and uses this to determine a house price-to-income ratio for every state.
Iowa has the lowest house price-to-income ratio at 3.3, meaning it takes 3.3 times the median household income ($69,588) to purchase a median-priced house ($230,600). At the other end of the scale, New York has the highest house price-to-income ratio at 10.3, where you’ll need 10.3 times the median income ($79,557) to buy a median-priced house ($819,900).
| State |
Median house price |
Median household income |
House price to income ratio |
| State Iowa |
Median house price $230,600 |
Median household income $69,588 |
House price to income ratio 3.3 |
| State Illinois |
Median house price $280,900 |
Median household income $76,708 |
House price to income ratio 3.7 |
| State Ohio |
Median house price $240,900 |
Median household income $65,720 |
House price to income ratio 3.7 |
| State Michigan |
Median house price $252,200 |
Median household income $66,986 |
House price to income ratio 3.8 |
| State Indiana |
Median house price $258,000 |
Median household income $66,785 |
House price to income ratio 3.9 |
| State Pennsylvania |
Median house price $278,700 |
Median household income $71,798 |
House price to income ratio 3.9 |
| State Wyoming |
Median house price $276,000 |
Median household income $70,042 |
House price to income ratio 3.9 |
| State Missouri |
Median house price $255,400 |
Median household income $64,811 |
House price to income ratio 3.9 |
| State Delaware |
Median house price $327,300 |
Median household income $82,174 |
House price to income ratio 4.0 |
| State Kansas |
Median house price $276,300 |
Median household income $68,925 |
House price to income ratio 4.0 |
| State Minnesota |
Median house price $341,700 |
Median household income $82,338 |
House price to income ratio 4.1 |
| State Nebraska |
Median house price $290,500 |
Median household income $69,597 |
House price to income ratio 4.2 |
| State Wisconsin |
Median house price $297,100 |
Median household income $70,996 |
House price to income ratio 4.2 |
| State Kentucky |
Median house price $251,300 |
Median household income $59,341 |
House price to income ratio 4.2 |
| State Oklahoma |
Median house price $253,200 |
Median household income $59,673 |
House price to income ratio 4.2 |
| State Alaska |
Median house price $379,600 |
Median household income $88,121 |
House price to income ratio 4.3 |
| State Maryland |
Median house price $421,800 |
Median household income $94,991 |
House price to income ratio 4.4 |
| State Connecticut |
Median house price $393,700 |
Median household income $88,429 |
House price to income ratio 4.5 |
| State Louisiana |
Median house price $257,400 |
Median household income $55,416 |
House price to income ratio 4.6 |
| State Arkansas |
Median house price $258,100 |
Median household income $55,432 |
House price to income ratio 4.7 |
| State Alabama |
Median house price $284,900 |
Median household income $59,674 |
House price to income ratio 4.8 |
| State Texas |
Median house price $357,800 |
Median household income $72,284 |
House price to income ratio 4.9 |
| State New Jersey |
Median house price $477,600 |
Median household income $96,346 |
House price to income ratio 5.0 |
| State New Hampshire |
Median house price $452,700 |
Median household income $89,992 |
House price to income ratio 5.0 |
| State Virginia |
Median house price $440,200 |
Median household income $85,873 |
House price to income ratio 5.1 |
| State Mississippi |
Median house price $271,200 |
Median household income $52,719 |
House price to income ratio 5.1 |
| State Georgia |
Median house price $375,300 |
Median household income $72,837 |
House price to income ratio 5.2 |
| State Vermont |
Median house price $385,300 |
Median household income $73,991 |
House price to income ratio 5.2 |
| State Maine |
Median house price $373,700 |
Median household income $69,543 |
House price to income ratio 5.4 |
| State North Carolina |
Median house price $371,100 |
Median household income $67,481 |
House price to income ratio 5.5 |
| State West Virginia |
Median house price $304,400 |
Median household income $54,329 |
House price to income ratio 5.6 |
| State Rhode Island |
Median house price $462,100 |
Median household income $81,854 |
House price to income ratio 5.6 |
| State Tennessee |
Median house price $377,200 |
Median household income $65,254 |
House price to income ratio 5.8 |
| State South Carolina |
Median house price $374,200 |
Median household income $64,115 |
House price to income ratio 5.8 |
| State New Mexico |
Median house price $349,200 |
Median household income $59,726 |
House price to income ratio 5.8 |
| State Arizona |
Median house price $436,100 |
Median household income $74,568 |
House price to income ratio 5.8 |
| State Florida |
Median house price $407,200 |
Median household income $69,303 |
House price to income ratio 5.9 |
| State Nevada |
Median house price $428,100 |
Median household income $72,333 |
House price to income ratio 5.9 |
| State Utah |
Median house price $529,600 |
Median household income $89,168 |
House price to income ratio 5.9 |
| State Idaho |
Median house price $460,900 |
Median household income $72,785 |
House price to income ratio 6.3 |
| State Colorado |
Median house price $580,900 |
Median household income $89,302 |
House price to income ratio 6.5 |
| State Massachusetts |
Median house price $614,700 |
Median household income $94,488 |
House price to income ratio 6.5 |
| State District of Columbia |
Median house price $668,250 |
Median household income $101,027 |
House price to income ratio 6.6 |
| State Oregon |
Median house price $510,900 |
Median household income $75,657 |
House price to income ratio 6.8 |
| State Washington |
Median house price $618,000 |
Median household income $91,306 |
House price to income ratio 6.8 |
| State Hawaii |
Median house price $720,200 |
Median household income $92,458 |
House price to income ratio 7.8 |
| State California |
Median house price $785,900 |
Median household income $91,551 |
House price to income ratio 8.6 |
| State New York |
Median house price $819,900 |
Median household income $79,557 |
House price to income ratio 10.3 |
*Data from Montana, North Dakota and South Dakota was not available
**Median house price as of May 2023, and median household income inflation adjusted to 2022.
Sources [9] U.S. Census - Census Bureau Tables https://data.census.gov/table?t=Income+(Households,+Families,+Individuals)&g=010XX00US$0400000&tid=ACSST1Y2021.S1903&moe=false&tp=true [10] World Population Review - Median Home Price by State https://worldpopulationreview.com/state-rankings/median-home-price-by-state
Average millennial income as a percentage of house prices
According to a 2022 study by real estate broker Redfin, if the average millennial earning $85,233 were to put aside every cent of their wage, it would take them a full four years to gather the funds to put a 20% deposit on a home worth $413,000. [11] Redfin - Millennial and Gen Z Renters Have Personal Inflation Rates Above 11% https://www.redfin.com/news/inflation-renters-gen-z-millennials-2022/
With costs like bills and other general living costs, it is highly likely that many millennials will take considerably longer than four years to save the costs needed to put a down payment on a property. Incomes for both Gen Zers and millennials have increased by 9.7% from 2020 to 2022, but, expenses have risen more, by 17%, meaning that more money is going on rent, bills, food, and gas. Asking rents are generally up by around 13.5% year over year ending July 2022. [12] Bankrate - Median Salary by Age https://www.bankrate.com/personal-finance/median-salary-by-age/ However, it is possible that millennials could have greater wages in time, and that wage rises may eventually equal inflation.
House price-to-income ratio in comparison to Baby Boomers
Compared to Baby Boomers, millennials are having to endure great disproportionate increases in housing prices against income levels.
In 1985, when the average Baby Boomer was in their early 30s, the median cost of a home was around $82,000. The median income was $23,500. The home price to income ratio was around 3.5, meaning that homes cost 3.5 times the average American salary back in 1985.
In comparison, for millennials who reached their 30s around 2019, the home price to income ratio is considerably greater. In 2019, the median house price was $313,000, and the median income was $68,700. This is a ratio of 4.6. To afford a home at the suggested 2.6 ratio, the average millennial would need to earn $120,400 as a salary – this is 75% higher than the median. [13] Anytime Estimate - Housing Prices vs Income https://anytimeestimate.com/research/housing-prices-vs-inflation/#:~:text=For millennials%2C who%2C on average,was $68%2C700 – a 4.6 ratio
Which locations have the most millennial homeowners?
Location also plays a part. The Mountain states and the Midwest have a higher percentage of millennial homeowners. Each state has varying house prices, job markets, living costs, and other social aspects that play a part in whether millennials can afford to buy property there.
A RentCafe analysis of IPUMS data including the 110 largest metro areas in the U.S. discovered the areas with the highest and lowest percentages of millennials owning homes.
Metro areas with the highest percentage of millennial homeowners
Midland, Texas is the area with the highest millennial homeownership rate at 82%, followed by Provo, Utah (76.2%), and Palm Bay, Florida (75.3%).
| Metro Area |
State |
Percentage of millennials owning |
Percentage of millennials renting |
| Metro Area Midland |
State Texas |
Percentage of millennials owning 82% |
Percentage of millennials renting 18% |
| Metro Area Provo |
State Utah |
Percentage of millennials owning 76.2% |
Percentage of millennials renting 23.8% |
| Metro Area Palm Bay |
State Florida |
Percentage of millennials owning 75.3% |
Percentage of millennials renting 24.7% |
| Metro Area Youngstown |
State Ohio |
Percentage of millennials owning 74% |
Percentage of millennials renting 26% |
| Metro Area Des Moines |
State Iowa |
Percentage of millennials owning 72.9% |
Percentage of millennials renting 27.1% |
| Metro Area Boise City |
State Idaho |
Percentage of millennials owning 71.7% |
Percentage of millennials renting 28.3% |
| Metro Area Portland |
State Maine |
Percentage of millennials owning 71.5% |
Percentage of millennials renting 28.5% |
| Metro Area North Port |
State Florida |
Percentage of millennials owning 70.9% |
Percentage of millennials renting 29.1% |
| Metro Area Columbia |
State South Carolina |
Percentage of millennials owning 68.5% |
Percentage of millennials renting 31.5% |
| Metro Area Greenville |
State South Carolina |
Percentage of millennials owning 67.4% |
Percentage of millennials renting 32.6% |
| Metro Area Nashville |
State Tennessee |
Percentage of millennials owning 67.3% |
Percentage of millennials renting 32.7% |
| Metro Area Akron |
State Ohio |
Percentage of millennials owning 67.0% |
Percentage of millennials renting 33.0% |
| Metro Area Charleston |
State West Virginia |
Percentage of millennials owning 65.9% |
Percentage of millennials renting 34.1% |
| Metro Area Wichita |
State Kansas |
Percentage of millennials owning 65.4% |
Percentage of millennials renting 34.6% |
| Metro Area Colorado Springs |
State Colorado |
Percentage of millennials owning 64.9% |
Percentage of millennials renting 35.1% |
| Metro Area Allentown |
State Pennsylvania |
Percentage of millennials owning 64.4% |
Percentage of millennials renting 35.6% |
| Metro Area Bakersfield |
State California |
Percentage of millennials owning 64.3% |
Percentage of millennials renting 35.7% |
| Metro Area Grand Rapids |
State Michigan |
Percentage of millennials owning 64.0% |
Percentage of millennials renting 36.0% |
| Metro Area Scranton |
State Pennsylvania |
Percentage of millennials owning 63.9% |
Percentage of millennials renting 36.1% |
| Metro Area Syracuse |
State New York |
Percentage of millennials owning 62.9% |
Percentage of millennials renting 37.1% |
Source [2] Rent Cafe - Millennials Make Historic Switch from Renter Majority to Owner Majority https://www.rentcafe.com/blog/rental-market/market-snapshots/millennials-switch-renter-to-owner-majority/
Metro areas with the lowest percentage of millennial homeowners
Salinas, California has the fewest millennial homeowners at just 18.9%, alongside San Jose, California (22.9%), and Asheville North Carolina (25.1%).
| Metro Area |
State |
Percentage of millennials owning |
Percentage of millennials renting |
| Metro Area Salinas |
State California |
Percentage of millennials owning 18.9% |
Percentage of millennials renting 81.1% |
| Metro Area San Jose |
State California |
Percentage of millennials owning 22.9% |
Percentage of millennials renting 77.1% |
| Metro Area Asheville |
State North Carolina |
Percentage of millennials owning 25.1% |
Percentage of millennials renting 74.9% |
| Metro Area Chattanooga |
State Tennessee |
Percentage of millennials owning 28.2% |
Percentage of millennials renting 71.8% |
| Metro Area Los Angeles |
State California |
Percentage of millennials owning 31.3% |
Percentage of millennials renting 68.7% |
| Metro Area Sacramento |
State California |
Percentage of millennials owning 32.1% |
Percentage of millennials renting 67.9% |
| Metro Area San Diego |
State California |
Percentage of millennials owning 32.4% |
Percentage of millennials renting 67.6% |
| Metro Area Durham |
State North Carolina |
Percentage of millennials owning 33.1% |
Percentage of millennials renting 66.9% |
| Metro Area Urban Honolulu |
State Hawaiii |
Percentage of millennials owning 33.6% |
Percentage of millennials renting 66.4% |
| Metro Area New York |
State New York |
Percentage of millennials owning 34.2% |
Percentage of millennials renting 65.8% |
| Metro Area Cleveland |
State Ohio |
Percentage of millennials owning 35.4% |
Percentage of millennials renting 64.6% |
| Metro Area San Francisco |
State California |
Percentage of millennials owning 37.4% |
Percentage of millennials renting 62.6% |
| Metro Area Winston-Salem |
State North Carolina |
Percentage of millennials owning 37.6% |
Percentage of millennials renting 62.4% |
| Metro Area Stockton |
State California |
Percentage of millennials owning 37.7% |
Percentage of millennials renting 62.3% |
| Metro Area Springfield |
State Massachusetts |
Percentage of millennials owning 38.7% |
Percentage of millennials renting 61.3% |
| Metro Area El Paso |
State Texas |
Percentage of millennials owning 38.8% |
Percentage of millennials renting 61.2% |
| Metro Area Lakeland |
State Florida |
Percentage of millennials owning 39.2% |
Percentage of millennials renting 60.8% |
| Metro Area Miami |
State Florida |
Percentage of millennials owning 39.3% |
Percentage of millennials renting 60.7% |
| Metro Area New Haven |
State Connecticut |
Percentage of millennials owning 39.7% |
Percentage of millennials renting 60.3% |
| Metro Area Myrtle Beach |
State South Carolina |
Percentage of millennials owning 39.7% |
Percentage of millennials renting 60.3% |
Source [2] Rent Cafe - Millennials Make Historic Switch from Renter Majority to Owner Majority https://www.rentcafe.com/blog/rental-market/market-snapshots/millennials-switch-renter-to-owner-majority/
This data indicates that in states like California, New York, and Hawaii, millennials are far more likely to rent than be homeowners, while in states like Idaho and Ohio, millennials are leading the way in their share of the homeowner market.
What is stopping millennials from buying homes?
There are various reasons why millennials aren't buying their own homes. For some, it's down to financial circumstances, and for others, it's life circumstances. Generally speaking, mortgage payments shouldn't take up more than 25% of a person's income.
As the gap between home values and millennial wages has widened, this is placing more of a squeeze on savers. 2018 figures from the U.S. Census Bureau indicated that many people are getting married later in life, with the average age for marriage at 29.8 for men and 27.8 for women. [14] U.S. Census - People Are Waiting to Get Married https://www.census.gov/library/visualizations/2018/comm/married.html
Putting off life events like having children and getting married can also cause people to put off buying a property. By the start of 2020, student debt in the U.S. had hit $1.6 trillion, with those in large amounts of debt taking years to pay back owed funds and to save for a house.
Healthcare costs, having to work multiple jobs to pay rent, tighter lending standards and the growing cost of living are all other concerns, and only time will tell if they become more or less of an impact on millennials and future generations. [15] Investopedia - Real Reasons Millennials Aren’t Buying Homes https://www.investopedia.com/news/real-reasons-millennials-arent-buying-homes/
Sources