The average credit score in Texas is 680. When you think of the Lone Star State, it usually includes oil wells, football, barbecue, and Stetsons. Credit in Texas is not usually what comes to mind, but the state has things to be both proud of and concerned about when it comes to borrowing money. Texans often have credit scores that can easily qualify for a conventional mortgage but credit card debt that can hamper their ability to pay for it.
When people know how to manage debt and get access to credit, it shows they can handle their expenses. But more than that, it’s a larger indicator of a state’s overall economic health, and a measure of its peoples’ ability to participate economically through the use of financial institutions.
Let’s take a look at what makes Texas a land of contrasts when it comes to debt, credit, and credit scores.
Key statistics
- Texas’ average credit score is 26th in the nation at 680.
- Texas’ average household debt in 2019 is $45,290. The average household debt nationwide in 2019 is $51,580.
- The average student loan amount in Texas rose almost $9,000 between 2006 and 2018. Nationally, average student loan amounts rose by only $1,400 between 2006 and 2019.
- Mortgage debt in Texas has risen almost 70 percent since 2003. Mortgage debt in the United States has increased by 46.55 percent in the same timeframe.
- Average credit card debt in Texas has increased almost 11 percent since 2003. The average credit card debt in the US increased 14.53 percent.
Texas’ Credit Score over Time
| Year | Average Credit Score |
|---|---|
| 2015 | 646.9 |
| 2016 | 696 |
| 2017 | 680 |
| 2018 | 680 |
| 2019 | 680 |
| 2020 | 680 |
As you can see in the graph above, the average credit score rose from 2015 to 2016, then leveled off but stayed consistent over the next four years. While certainly not the lowest score in the nation (that title is claimed by Mississippi at 647 [7] Average Credit Score By State & City 2020 https://www.self.inc/info/average-credit-score-by-state-city/), Texas credit scores fell solidly in the middle nation-wide at around 26th in 2020. But when you compare Texas’ average credit score to the national average, it’s lower in four of the last six years.

How to Build Credit When You Have None
Building credit from scratch can be a lot easier when you understand where to start and which mistakes to avoid.
Download our guideHow credit scores in Texas compare to other states
| Year | Average Credit Score - TX | National Average |
|---|---|---|
| 2015 | 646.9 | 658 |
| 2016 | 696 | 713 |
| 2017 | 680 | 678 |
| 2018 | 680 | 704 |
| 2019 | 680 | 706 |
| 2020 | 680 | 678 |
The fact that Texas’ credit score is lower than the national average is consistent with trends across the southern United States. One statistic that may contribute to this is lower than average median income. Texans make $60,629, just under the national median income of $61,937. [6] Texas State Data - DataUSA https://datausa.io/profile/geo/texas Healthier incomes help people keep up with debt payments, so lower income could have a negative impact on building and maintaining healthy credit scores.
Another score that Texas doesn’t seem able to escape is slightly higher than average consumer debt. In 2019, this debt was $3,470 per person, slightly above the national average of $3,390.
Debt in Texas
As of 2019, the total household debt in Texas was $45,290. Household debt can be hard to understand and address because there are so many ways to fall into it. Not only is going into debt easier, but owing more money over longer periods of time has become easier too. The average loan amount in Texas is on the rise, going from $21,672 in 2006 to $30,549 in 2018 (figures adjusted for inflation) [2] Consumer Credit Trends for Texas https://www.dallasfed.org/cd/cct/19ccttx.aspx
As tricky as managing debt can be for consumers, managing access to debt for lenders is equally as tricky. Tightening credit restrictions may seem, at first glance, like a solution to limit the amount of people going into debt who can’t afford it. But it can also stifle the growth of a state’s economy, as well as its gross domestic product.
However, making credit too widely available can have equally troubling consequences. It can trap consumers in a cycle of debt, as well as well as lead to more defaults and depletion of personal savings. If too many of these events occur it can lead to artificially inflated economic bubbles, like the one that lead to the subprime mortgage crisis of 2007.
Mortgage Debt
| Year | Average Mortgage Debt - TX | Average Mortgage Debt - US |
|---|---|---|
| 2003 | 16,230 | 23,740 |
| 2004 | 17,700 | 26,590 |
| 2005 | 18,630 | 29,230 |
| 2006 | 19,990 | 33,400 |
| 2007 | 22,630 | 37,250 |
| 2008 | 24,200 | 38,490 |
| 2009 | 24,070 | 36,810 |
| 2010 | 23,630 | 35,010 |
| 2011 | 23,470 | 34,200 |
| 2012 | 23,200 | 33,230 |
| 2013 | 22,220 | 31,630 |
| 2014 | 22,590 | 31,520 |
| 2015 | 23,280 | 31,330 |
| 2016 | 23,770 | 31,590 |
| 2017 | 25,030 | 32,940 |
| 2018 | 26,330 | 33,680 |
| 2019 | 27,450 | 34790 |
Mortgage debt in Texas has been steadily rising with the notable exception of the period during the Great Recession of 2008 until 2013. By 2018, it had risen back to pre-recession levels. Overall, mortgage debt has risen 69 percent between 2003 and 2020.
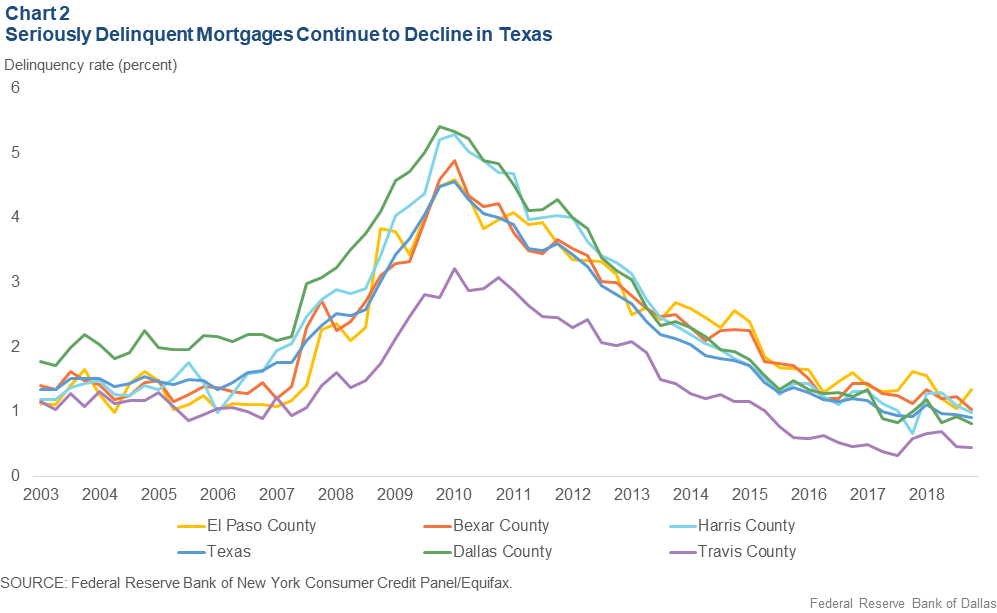
This type of debt can be analyzed several ways. Two common ways to examine mortgage debt are by looking at volume and delinquencies. When looking at volume, you compare the amount of mortgages held by prime borrowers compared to subprime borrowers. Texas’ share of prime borrowers taking out mortgage loans has gotten larger over time. It grew from 67 percent of the aggregate total volume of mortgages underwritten in 2006 to 81 percent by the year 2018. [2] Consumer Credit Trends for Texas https://www.dallasfed.org/cd/cct/19ccttx.aspx
This steady growth is good for the economy because a higher percentage of prime borrowers means fewer subprime borrowers. Prime borrowers are less likely to default and delinquencies should drop. That’s exactly what occurred, in fact. Mortgage delinquencies spiked between 2008 and 2010 due to the recession, but they dropped and continued to drop once the economy stabilized.
 Source [2] Consumer Credit Trends for Texas https://www.dallasfed.org/cd/cct/19ccttx.aspx
So if delinquencies are dropping and borrowers are better able to pay off loans, why is mortgage debt rising? The answer to that lies in the behavior of prime borrowers. A big group of borrowers with income large enough to handle long-term debt easily will target more expensive homes. Borrowers with prime credit are purchasing more expensive houses than they were 12 years ago, while their counterparts with lower credit scores have experienced no change in the value of house they can afford. [2] Consumer Credit Trends for Texas https://www.dallasfed.org/cd/cct/19ccttx.aspx
Credit Card Debt
| Year | Average Credit Card Debt - TX | Average Credit Card Debt - US |
|---|---|---|
| 2003 | 3,130 | 2,960 |
| 2004 | 3,140 | 3,040 |
| 2005 | 3,170 | 3,060 |
| 2006 | 3,210 | 3,170 |
| 2007 | 3,450 | 3,490 |
| 2008 | 3,540 | 3,670 |
| 2009 | 3,200 | 3,370 |
| 2010 | 2,900 | 3,050 |
| 2011 | 2,800 | 2,950 |
| 2012 | 2,750 | 2,850 |
| 2013 | 2,590 | 2,710 |
| 2014 | 2,640 | 2,730 |
| 2015 | 2,760 | 2,800 |
| 2016 | 2,940 | 2,930 |
| 2017 | 3,140 | 3,100 |
| 2018 | 3,270 | 3,220 |
| 2019 | 3,470 | 3,390 |
Credit card debt is one area that Texans should be concerned about. In 2019, over half of them carried a balance on credit cards [2] Consumer Credit Trends for Texas https://www.dallasfed.org/cd/cct/19ccttx.aspx, and the amount of lawsuits filed by collectors or lenders in the state’s courts rose 140 percent since 2014. [1] The economy is booming. So why are credit card debt cases clogging Texas courts? https://www.houstonchronicle.com/politics/texas/article/The-economy-is-booming-So-why-are-credit-card-14119383.php Average credit card debt statewide, while experiencing ups and downs during periods of recession, has increased 10.86 percent since 2003.
One of the reasons these stats are surprising is that Texas is, by and large, a good state to be in if you have to carry debt. Texas places heavy restrictions on debt collectors. For example, collection agencies cannot garnish a person’s wages or take a person’s house. A state with these restrictions seeing large spikes in litigation against debtors is likely indicative of a growing consumer debt problem.
One of the curses of a booming economy is that its rising tide doesn’t always lift all boats. While wages may go up overall, fixed incomes generally don’t. But, this doesn’t stop rent and other costs of living from rising. This forces many low and fixed income individuals into debt in a losing battle to make ends meet.
Car and Auto Debt
| Year | Average Auto Loan Debt - TX | Average Auto Loan Debt - US |
|---|---|---|
| 2003 | 3,940 | 2,960 |
| 2004 | 3,800 | 3,040 |
| 2005 | 4,130 | 3,240 |
| 2006 | 4,320 | 3,360 |
| 2007 | 4,600 | 3,360 |
| 2008 | 4,730 | 3,310 |
| 2009 | 4,380 | 3,030 |
| 2010 | 4,220 | 2,950 |
| 2011 | 4,380 | 3,050 |
| 2012 | 4,790 | 3,270 |
| 2013 | 5,010 | 3,420 |
| 2014 | 5,480 | 3,720 |
| 2015 | 6,070 | 4,070 |
| 2016 | 6,370 | 4,340 |
| 2017 | 6,520 | 4,520 |
| 2018 | 6,720 | 4,700 |
| 2019 | 6,880 | 4,850 |
In a sprawling state like Texas, automobiles are a necessity. Fortunately, Texans live where oil is big business. As a result, driving costs are relatively low compared to other states. Texas’ sprawl means parking is plentiful, and alternative modes of transportation like public transit are less prevalent. All these factors plus lower home prices free up disposable income. This creates the fuel for a strong consumer auto industry. [3] Texans Help Drive National Increase in Auto Loan Debt https://www.dallasfed.org/~/media/documents/research/swe/2019/swe1903b.pdf
Because of a booming economy with easier access to credit, auto loan delinquencies are one area where Texas exceeds the national average. The high rate of delinquencies is driven primarily by subprime borrowers. While the volume of subprime borrowers for homes is dropping, it’s rising for automobiles. This is because of a larger young, low-income, and immigrant population across the state. Portions of these populations have credit scores below 620. [3] Texans Help Drive National Increase in Auto Loan Debt https://www.dallasfed.org/~/media/documents/research/swe/2019/swe1903b.pdf
Subprime borrowers often face two key factors that compound the rate of delinquencies. The first is that the price of a car increases faster than the borrower’s income can keep pace with it. The average size of loans for passenger cars has gone up, exceeding $32,000 in 2018. The average monthly payment comes in at around $550. [3] Texans Help Drive National Increase in Auto Loan Debt https://www.dallasfed.org/~/media/documents/research/swe/2019/swe1903b.pdf
A subprime loan’s interest rate is about 5-10 percent higher than a conventional auto loan, so how can a borrower get a monthly payment down to a manageable number? By increasing the term of the loan, often to beyond the expected life of the car. Average maturity of new-car loans has increased from 59.5 months (4.95 years) in 2008 to 66.5 months (5.5 years) by 2018. [3] Texans Help Drive National Increase in Auto Loan Debt https://www.dallasfed.org/~/media/documents/research/swe/2019/swe1903b.pdf All of these factors have resulted in average auto loan debt in Texas going up a staggering 74.6 percent since 2003.
Student Loan Debt
| Year | Student Loan Debt - TX | Student Loan Debt - US |
|---|---|---|
| 2003 | 910 | 1,060 |
| 2004 | 1,250 | 1,440 |
| 2005 | 1,470 | 1,610 |
| 2006 | 1,740 | 1,970 |
| 2007 | 1,970 | 2,250 |
| 2008 | 2,350 | 2,670 |
| 2009 | 2,680 | 3,010 |
| 2010 | 2,990 | 3,370 |
| 2011 | 3,240 | 3,620 |
| 2012 | 3,610 | 4,000 |
| 2013 | 3,740 | 4,250 |
| 2014 | 4,000 | 4,490 |
| 2015 | 4,180 | 4,660 |
| 2016 | 4,460 | 4,920 |
| 2017 | 4,700 | 5,130 |
| 2018 | 4,970 | 5,390 |
| 2019 | 5100 | 5510 |
Graduating college is one of life’s happiest occasions, except for one thing: starting payments on student loans. Unfortunately, a degree is not the guarantee it once was of a salary large enough to pay for rent, food, transportation, and loan payments. In 2020, 43 million borrowers in the U.S. took out student loans. In 2003, only 19 million took out loans. [4] Student Loan Debt in Texas https://comptroller.texas.gov/economy/fiscal-notes/2020/mar/studentloan.php The average amount borrowed has increased ($33,000 in 2019 versus $13,000 in 2003). The cost of college is still the only cost that consistently and easily outpaces inflation.
Although debt for Texas college students has risen significantly since 2003, a staggering 460 percent, it has leveled off somewhat since 2017. This is partly because students are now better informed on the size of their student loan debt. In 2017, officials amended the Texas Education Code. [4] Student Loan Debt in Texas https://comptroller.texas.gov/economy/fiscal-notes/2020/mar/studentloan.php They added a requirement that schools of higher education that use a state financial aid program administered by the Texas Higher Education Coordinating Board (THECB) send regular notifications to students. It contains information about loan amounts borrowed to date and estimates of future payments. [5] Summary of SB 0887: Student Debt Notification Letter http://www.thecb.state.tx.us/DocID/PDF/9720.PDF
Sources
- [1] The economy is booming. So why are credit card debt cases clogging Texas courts? https://www.houstonchronicle.com/politics/texas/article/The-economy-is-booming-So-why-are-credit-card-14119383.php
- [2] Consumer Credit Trends for Texas https://www.dallasfed.org/cd/cct/19ccttx.aspx
- [3] Texans Help Drive National Increase in Auto Loan Debt https://www.dallasfed.org/~/media/documents/research/swe/2019/swe1903b.pdf
- [4] Student Loan Debt in Texas https://comptroller.texas.gov/economy/fiscal-notes/2020/mar/studentloan.php
- [5] Summary of SB 0887: Student Debt Notification Letter http://www.thecb.state.tx.us/DocID/PDF/9720.PDF
- [6] Texas State Data - DataUSA https://datausa.io/profile/geo/texas
- [7] Average Credit Score By State & City 2020 https://www.self.inc/info/average-credit-score-by-state-city/