The Cost of Unused Paid Subscriptions 2026
Since 2023, surveys on behalf of Self Financial have asked respondents in the U.S.
questions about their subscriptions and how many of these paid subscriptions went unused. In 2023, 54.6% of
respondents had at least one paid subscription going unused each month, and in 2024, this figure increased to
85.7%. However, in 2025, this figure decreased to 54.9%.
To find out the true cost of subscriptions and the price Americans pay for leaving
them unused in 2026, a survey on behalf of Self Financial collected views from 1,272 people in the U.S. The
results highlight the most popular subscription services and how many paid subscriptions are going unused
overall.
Key findings from the survey:
- The average respondent has 3.4 active paid subscriptions – up
from 2.8 in 2025, but still down from 4.4 in 2023.
- Most people reported spending $35.03 monthly on average for their paid
subscriptions, down from $37 in 2025, $40.39 in 2024 and
$52.97 in 2023.
- 59.9% of respondents admitted they had a paid
subscription going unused each month – at an average of 2.6 subscriptions not being
used.
- The monthly average value of unused paid subscriptions is
$26.79 – an increase from $10.57 in 2025 but a decrease from $32.84 in 2024.
- 57.6% of respondents admit that they would be
more inclined to illegally stream TV and movies due to the increased costs of streaming services, up from
45.7% in 2025.
- Starz is the most common unused paid-for streaming subscription
(49.6%), Disney+ is the second most (44.4%), followed by
Netflix (38.1%).
- DoorDash is the most common unused paid-for food subscription
(48.2%), Grubhub is the second most (38.5%), followed by
Caviar (38.4%).
- 76.2% of paid subscription customers share logins with other
people–up from 46.5% in 2025 – with 35.8% admitting the reason is to save money.
Paid subscription services
To learn more about Americans' consumption habits regarding paid subscription
services, a survey on behalf of Self Financial asked respondents a series of questions about the current
subscriptions they have in place and the impact these have on their finances and everyday lives.
On average, households have 3.4 paid subscriptions active
The number of subscriptions people have can differ hugely based on a number of
factors, including household income, expenses, and the amount of free time a person has.
The survey found that most respondents had 3.4 paid subscription services active in
a typical month. This is more than the average of 2.8 when the survey was conducted previously in 2025, but
still less than the average of 4.4 in 2023. Some people may cancel and change subscriptions each month, so
respondents were asked to answer in relation to a typical month in their household.
Almost two-thirds of respondents (61.9%) prefer to pay for their subscriptions
monthly, almost one in three (30%) opt for a weekly payment, and 6.2% pay annually. Other respondents indicated
other payment periods or may have others who pay for their subscriptions.
Yearly payments are often cheaper than monthly payments, suggesting most people
don’t opt to claim such financial benefits. For example, Disney+ Premium’s monthly plan with no ads as of
October 2025 costs $18.99, but paid annually, it costs $189.99, a saving of $37.89. [1] Disney Plus, ‘Disney+ plans and prices’ https://help.disneyplus.com/article/disneyplus-en-us-price It is, however, important to note that in some cases, this would only be a saving if a user were 100% sure they
were going to use the platform for all 12 months. For example, subscribers billed directly by Disney+ who cancel
partway through a billing period will retain access to the service until the end of their current subscription
term, rather than receiving a refund. [2] Disney+, ‘How to cancel Disney+’ https://help.disneyplus.com/article/disneyplus-cancel
Over one in six (16%) respondents think that a price increase on their
subscriptions would be unacceptable
When asked what price increases would be acceptable in the coming year, over one in
six (16%) respondents said that no price increase would be acceptable. In comparison, in 2025 almost half
(49.7%) of respondents said that no price increase would be acceptable. In 2026, almost two in five (38.1%) said
that an increase of 3-5% would be acceptable, while 16.3% said they would accept an increase of as much as
6-10%.
$35.03 is the average monthly cost of paid subscriptions for respondents in the
U.S.
Subscription models can come in all shapes and sizes, designed around the customer's
needs. But how much, on average, are Americans spending on their paid subscriptions each month?
| Average monthly spend on paid subscriptions |
| Year |
Average monthly spend |
| 2023 |
$52.97 |
| 2024 |
$40.39 |
| 2025 |
$37.00 |
| 2026 |
$35.03 |
The survey found that the average monthly cost of paid subscriptions is $35.03,
which is 5.3% less than the $37 average in the 2025 survey.
When analyzing the most common price ranges of paid subscriptions, over two-thirds
of the respondents (67.3%) spend less than $30 on subscriptions each month. Just 7% spend more than $100 per
month on subscriptions.
70% admit to being locked into a paid subscription because they forgot to cancel it
The 2026 survey found that 70% of participants have forgotten to cancel a free trial
at some point, locking them into a paid subscription.
When asked how many times this had occurred, 50% said it was twice, while 20%
admitted this had happened at least three times.
On average, forgetting to cancel these paid subscriptions has cost participants
$34.31 in total and for 37.8%, this unexpected expense meant they had to cut back on other outgoings. Over a
fifth (21.7%) said they had to borrow money from a relative to overcome this cost.
Sharing paid subscription logins
A big draw for people when using subscription services is that they are able to
share their experience with others. However, streaming services such as Netflix and Disney+ have made it
increasingly more difficult to successfully share passwords with others outside of your household.
[3] People, ‘Disney+ Password Sharing Crackdown: Everything You Need to Know’, 2024 https://people.com/disney-password-sharing-crackdown-everything-you-need-to-know-8718596 [4] Stuff.tv, ‘Netflix password sharing crackdown: what to do about it if you share your Netflix login’, 2025 https://www.stuff.tv/features/netflix-password-sharing-what-to-do-about-the-steaming-services-crackdown/
Over three quarters (76.2%) share their logins with other people and 35.8% admit
the reason is to save money
Sharing paid subscriptions for music, movies, and TV between family members is a
good way to reduce costs while still keeping the benefits of the service. Some services, like Netflix, however,
are actively discouraging this with 2023 measures stopping password sharing outside of physical households.
Disney+ followed suit in March 2024, with HBO Max announcing their own crackdown in 2025.
[5] CNBC, ‘Warner Bros. Discovery starts Max password-sharing crackdown’, 2025 https://www.cnbc.com/2025/04/22/wbd-max-password-sharing-crackdown.html
The survey asked the subscriber respondents if they shared their logins, or were
recipients of shared logins, for paid subscriptions with people outside of their household. Despite the password
crackdowns, in 2025 almost half (46.5%) of respondents said that they shared their logins with other people, and
this has increased to 76.2% in 2026.
On the other hand, when asked whether they use other people’s logins, 41.8% of
respondents in 2025 admitted that they did, compared to 70.8% in 2026.
Of the 70.8% in 2026 that said they use the login details of other people's paid
subscriptions, just 27.2% said they contribute towards the cost, which means 43.6% are “freeloading”. On the
other hand, among the 72.6% that said they share the logins to their paid subscriptions with other people, 37.7%
are said to contribute towards the cost, while 38.5% don’t.
35.8% of paid subscription customers share logins to save money
Of those who shared their logins and passwords for services with others, over a
third (35.8%) said they did so to save money and split costs – down from 64.4% in 2025, but slightly up from
32.8% in 2024. In 2026, participants were more likely to say the reason for sharing logins was to give friends
or family access (43.2%) or share the experiences or content socially (36.2%).
| Top 5 reasons for sharing paid subscription service logins* |
| Rank |
Reason for sharing logins |
Percentage of respondents |
| 1 |
To give friends or family access |
43.2% |
| 2 |
To share experiences or content socially |
36.2% |
| 3 |
To save money / split the cost |
35.8% |
| 4 |
To make full use of the subscription |
23.3% |
| 5 |
Generosity / helping others |
16.3% |
*Respondents could choose multiple answers.
When asked how they would react to their paid subscriptions cracking down on
password sharing, over a quarter (28.4%) said this would make them reconsider their membership type, potentially
paying for more accounts, compared to 22.2% who said they would cancel their subscription altogether.
66.9% of respondents have wanted to cancel a subscription but didn’t
Two-thirds of respondents (66.9%) said they have wanted to cancel a paid for
subscription but didn’t. The top reasons cited for this were a fear of missing out on content or features
(52.3%), forgetfulness (51.7%) and convenience or habit (44.2%).
| Top 5 reasons for not cancelling a paid subscription service* |
| Rank |
Reason for not cancelling |
Percentage of respondents |
| 1 |
Fear of missing out on content or features |
52.3% |
| 2 |
Forgetfulness |
51.7% |
| 3 |
Convenience or habit |
44.2% |
| 4 |
Automatic renewal |
31.4% |
| 5 |
Cancellation process too complicated |
23.8% |
*Respondents could choose multiple answers.
57.6% of respondents admitted they would be more inclined to illegally stream TV
and movies
In the U.S., downloading and sharing copyrighted material – like popular TV shows or
movies – is illegal. People on the internet can access copyrighted material via peer-to-peer file sharing.
Someone found liable for copyright infringement, depending on the type of infringement, can be fined between
$750 and $250,000 per offense. [6] Office of Academic Integrity & Student Conduct, ‘Digital Millennium Copyright Act (DMCA)’ https://conduct.uci.edu/dmca/
Despite the risks, 57.6% of respondents admitted that they would be more inclined to
illegally stream TV and movies due to the increased costs of streaming services. This is up from 45.7% in 2025.
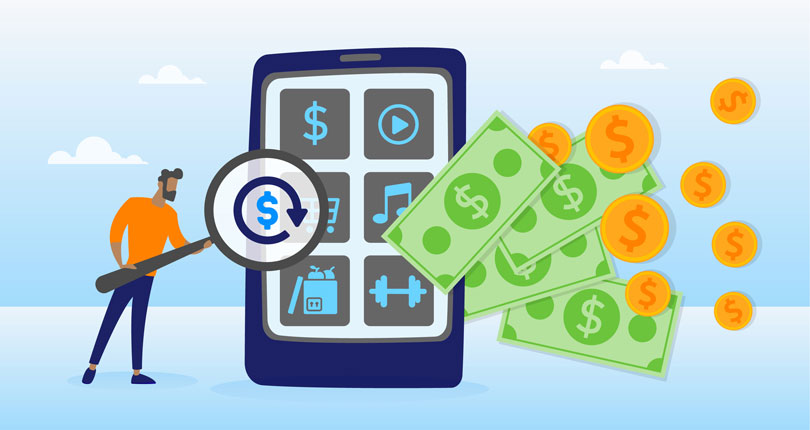
Unused paid subscriptions
To better understand how many paid subscriptions are going unused, the survey asked
the subscribers if any of their paid subscriptions were still being paid for each month, despite not being used.
The survey defines ‘unused’ paid subscriptions as those being paid for but that had
not been used in the past 30 days. This took into account the popularity of subscriptions paid monthly, which
61.9% of people prefer, and which indicates that at least one monthly payment would have been wasted if the
subscription was not used for 30 days.
Almost three in five (59.9%) survey respondents said that they have at least one
paid subscription going unused. This is up from 54.9% in 2025, but down from 85.7% in 2024.
Respondents have 2.6 paid subscriptions going
unused, compared to 0.8 in 2025.
Taking an average from the responses, the results showed that typically subscribers
have around 2.6 subscriptions that they aren’t using each month (up from 0.8 in 2025).
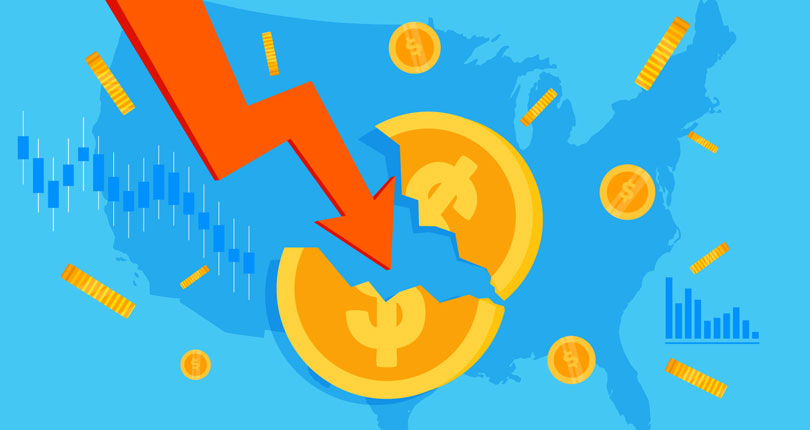
Subscribers are wasting an average of $26.79 per month on unused paid subscriptions
The survey also sought to find out how much people were spending on their unused
subscriptions each month.
Considering that a respondent has, on average, 2.6 subscriptions going unused, the
monthly average value of unused paid subscriptions is $26.79 – an increase from $10.57 in 2025 but an decrease
from $32.84 in 2024
Starz is the most common unused paid streaming subscription
In the U.S., a majority (83%) of adults use streaming services.
[7] Pew Research, ‘83% of U.S. adults use streaming services, far fewer subscribe to cable or satellite TV’ https://www.pewresearch.org/short-reads/2025/07/01/83-of-us-adults-use-streaming-services-far-fewer-subscribe-to-cable-or-satellite-tv/ The survey asked the respondents who currently have unused subscriptions which
popular paid platforms they subscribed to but had not used in the past 30 days.
Starz was found to be the most common paid subscription that they hadn’t used in the
past 30 days (49.6%). In 2025, the most common unused streaming subscription was ESPN+ (25.8%), followed by Hulu
(25.7%).
In 2026, Disney+ came in close behind, with 44.4% of respondents leaving their
subscription unused.
| The percentage of paid streaming subscriptions going unused |
| Rank |
Paid streaming subscription model |
Percentage of subscribers who didn’t use their subscription (2025) |
Percentage of subscribers who don’t use their subscription (2026)* |
| 1 |
Starz |
24.5% |
49.6% |
| 2 |
Disney+ |
23.3% |
44.4% |
| 3 |
Netflix |
17.1% |
38.1% |
| 4 |
HBO Max |
20.7% |
35.7% |
| 5 |
Apple TV+ |
19.6% |
34.1% |
| 6 |
Hulu |
25.7% |
32.6% |
| 7 |
Peacock |
19.4% |
29.4% |
| 8 |
Paramount+ |
24.8% |
26.6% |
| 9 |
ESPN+ |
25.7% |
26.5% |
| 10 |
Amazon Prime Video |
22.3% |
25.6% |
*considering respondents who have this subscription, but
have not used it in 30 days or more.
However, those who would unsubscribe from a streaming service were most likely to
unsubscribe from Amazon Prime Video (38.5%), followed by Disney+ (33.9%), and Netflix (32.3%).
DoorDash is the most commonly unused paid food delivery subscription
In 2025, a separate study on behalf of
Self Financial on the most expensive food delivery apps in U.S. cities found that without a subscription, the
average markup on food from a restaurant by a food-delivery service was 68.8%.
Considering these additional fees, if you’re someone who orders takeout food often,
it may be worth having a food-delivery subscription. In this survey, 48.2% of respondents said that they had not
made use of their DoorDash subscriptions in the past month. Grubhub and Caviar subscriptions were the next most
likely to be forgotten about (38.5% and 38.4% respectively).
| The percentage of paid food-app subscriptions going unused |
| Rank |
Subscription model |
Percentage of subscribers who didn’t use their subscription (2025) |
Percentage of subscribers who don’t use their subscription (2026)* |
| 1 |
DoorDash |
43.2% |
48.2% |
| 2 |
Grubhub |
54.1% |
38.5% |
| 3 |
Caviar |
58.9% |
38.4% |
| 4 |
Postmates |
52.0% |
29.8% |
| 5 |
Uber Eats |
51.4% |
27.5% |
*considering respondents who have this subscription, but
have not used it in 30 days or more.
However, those who would unsubscribe from a food delivery service were most likely
to unsubscribe from Uber Eats (36.2%), followed by Caviar (24.5%), and DoorDash (23.7%).
Bumble is the most commonly unused paid dating app subscription
The survey also asked which dating services respondents subscribed to but haven’t
used in over 30 days.
Bumble was revealed as the dating service that most people weren’t regularly using,
with 51.7% not using their dating service subscription in 30 days or more. In 2025, the research found that the
most commonly unused dating subscription was Badoo (62.2%).
In 2026, Bumble was followed by Hinge (44.5%) and OkCupid came third (44.2%) among
the dating services most unused by the survey’s respondents.
| The percentage of paid dating-app subscriptions going unused* |
| Rank |
Subscription model |
Percentage of subscribers who didn’t use their subscription (2025) |
Percentage of subscribers who don’t use their subscription (2026)* |
| 1 |
Bumble |
52.0% |
51.7% |
| 2 |
Hinge |
50.0% |
44.5% |
| 3 |
OkCupid |
61.4% |
44.2% |
| 4 |
Badoo |
62.2% |
41.9% |
| 5 |
Coffee Meets Bagel |
48.0% |
38.1% |
| 6 |
Plenty of Fish |
57.1% |
33.3% |
| 7 |
Tinder |
53.2% |
31.7% |
| 8 |
Grindr |
53.3% |
29.7% |
*considering respondents who have this subscription, but
have not used it in 30 days or more.
Those who would unsubscribe from a dating service were most likely to unsubscribe
from Tinder (26.5%), followed by Plenty of Fish (22.2%), and Bumble (18.3%).
Wayfair is the most commonly unused paid e-commerce subscription
E-commerce subscriptions often provide subscribers with perks like free delivery and
savings on items. Over two-fifths (41.2%) of Wayfair subscribers surveyed had not used the service for 30 days
or more. Amazon Prime followed (36.7%), and Home Depot.com came third (35.2%).
In 2025, 57.3% of Best Buy subscribers surveyed had not used the service for 30 days
or more. Wayfair followed (57.1%), and Home Depot.com came third (54.7%).
| The percentage of paid e-commerce subscriptions going unused* |
| Rank |
Subscription model |
Percentage of subscribers who didn’t use their subscription (2025) |
Percentage of subscribers who don’t use their subscription (2026)* |
| 1 |
Wayfair |
57.1% |
41.2% |
| 2 |
Amazon Prime |
26.0% |
36.7% |
| 3 |
Homedepot.com |
54.7% |
35.2% |
| 4 |
Costco |
21.9% |
34.5% |
| 5 |
Bestbuy.com |
57.3% |
34.2% |
| 6 |
Target |
52.0% |
31.5% |
| 7 |
Walmart |
38.1% |
31.2% |
*considering respondents who have this subscription, but
have not used it in 30 days or more
Those who would unsubscribe from an e-commerce service were most likely to
unsubscribe from Walmart (36.2%), followed by Amazon Prime (31.1%), and Target (26.1%).
Strava is the most commonly unused paid fitness subscription
There are a multitude of popular fitness subscriptions to help you keep active.
These range from workout planners (like Gymverse) to biometric trackers (like Fitbit) to GPS tracking services
(like Strava). Of the nine fitness subscriptions considered in the survey, 55% of respondents said that they had
not used their Strava subscription in a month or more, more than the 45.6% of respondents who said they had not
utilized their Hevy subscription in the same period.
| The percentage of paid fitness subscriptions going unused* |
| Rank |
Subscription model |
Percentage of subscribers who didn’t use their subscription (2025) |
Percentage of subscribers who don’t use their subscription (2026)* |
| 1 |
Strava |
50.0% |
55% |
| 2 |
Hevy |
12.0% |
45.6% |
| 3 |
PUSH |
60.1% |
44.9% |
| 4 |
Runkeeper |
0% |
38.1% |
| 5 |
Strong |
53.8% |
35.3% |
| 6 |
Gymverse |
16.0% |
32.4% |
| 7 |
Runna |
57.7% |
32.0% |
| 8 |
Fitbit |
59.1% |
31.1% |
| 9 |
Apple Fitness |
51.6% |
29.0% |
*considering respondents who have this subscription, but
have not used it in 30 days or more
Those who would unsubscribe from a fitness service were most likely to unsubscribe
from Apple Fitness (31.1%), followed by Fitbit (27.2%), and Strava (14.4%).
ChatGPT is the most commonly unused paid AI subscription
There are a number of AI tools that promise to improve efficiency, speed and
understanding. Many of these come with a paid subscription required to use the most up to date technology.
The survey asked participants about their paid use of ten AI subscriptions
platforms, and the findings show that ChatGPT is the most commonly unused (50.4%). This is followed by
Midjourney (42.6%) and Canva AI (40.2%).
| The percentage of paid AI subscriptions going unused* |
| Rank |
Subscription model |
Percentage of subscribers who don’t use their subscription (2026)* |
| 1 |
ChatGPT |
50.4% |
| 2 |
Midjourney |
42.6% |
| 3 |
Canva AI |
40.2% |
| 4 |
Grammarly AI |
38.7% |
| 5 |
Jasper AI |
37.8% |
| 6 |
Notion AI |
36.8% |
| 7 |
Writesonic |
36.6% |
| 8 |
Perplexity |
35.8% |
| 9 |
Gemini |
35.3% |
| 10 |
Claude |
27.2% |
*considering respondents who have this subscription, but
have not used it in 30 days or more
However, those who would unsubscribe from an AI platform were most likely to
unsubscribe from ChatGPT (46.3%), followed by Claude (36.6%), and Gemini (29.9%).
ChatGPT is the AI platform that respondents are
most likely to unsubscribe from next.
Nine in ten (90.3%) participants who have a paid AI subscription said they believe
the paid versions are better value than a free version. Although the quality may be better, 32.1% said the
service becoming too expensive for the value provided would lead them to cancel their subscription.
Methodology
The survey was conducted in March 2026, asking 1,272 U.S. adults from a range of
backgrounds questions related to subscription services. Only participants who reported having at least one paid
subscription were asked about usage and cost. To understand how many of these subscriptions go unused, the
survey conducted on behalf of Self Financial explored factors such as cost, usage, subscription models and
preferences. For some questions, respondents could select multiple answers, so totals may not sum to 100%.
‘Unused’ paid subscriptions were defined as those that were being paid for but had
not been used in the last 30 days, to tie into the popularity of 30-day trials.
2024 prices were retrieved via Wayback Machine: https://web.archive.org/
Sources
- [1] Disney Plus, ‘Disney+ plans and prices’ https://help.disneyplus.com/article/disneyplus-en-us-price
- [2] Disney+, ‘How to cancel Disney+’ https://help.disneyplus.com/article/disneyplus-cancel
- [3] People, ‘Disney+ Password Sharing Crackdown: Everything You Need to Know’, 2024 https://people.com/disney-password-sharing-crackdown-everything-you-need-to-know-8718596
- [4] Stuff.tv, ‘Netflix password sharing crackdown: what to do about it if you share your Netflix login’, 2025 https://www.stuff.tv/features/netflix-password-sharing-what-to-do-about-the-steaming-services-crackdown/
- [5] CNBC, ‘Warner Bros. Discovery starts Max password-sharing crackdown’, 2025 https://www.cnbc.com/2025/04/22/wbd-max-password-sharing-crackdown.html
- [6] Office of Academic Integrity & Student Conduct, ‘Digital Millennium Copyright Act (DMCA)’ https://conduct.uci.edu/dmca/
- [7] Pew Research, ‘83% of U.S. adults use streaming services, far fewer subscribe to cable or satellite TV’ https://www.pewresearch.org/short-reads/2025/07/01/83-of-us-adults-use-streaming-services-far-fewer-subscribe-to-cable-or-satellite-tv/