Money
Money Household Budget Statistics
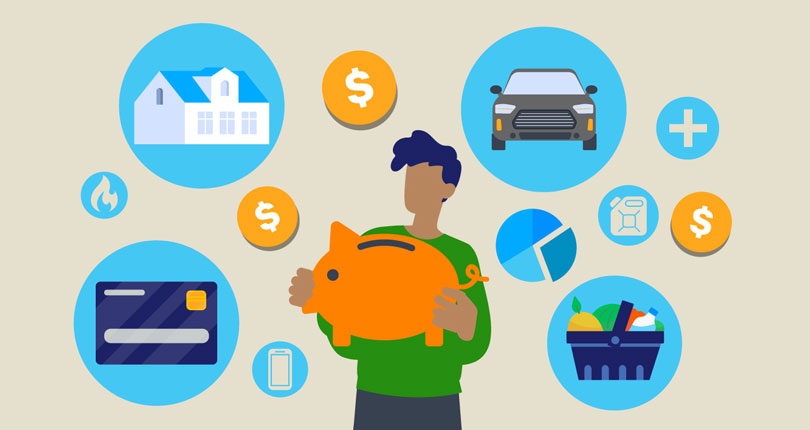

Budgeting plays an essential role in financial stability, but managing income and expenses could be a source of worry for some.
The average U.S. household spent $78,535 in 2024 based on the latest available U.S. Bureau of Labor Statistics Consumer Expenditure Survey, with costs increasing across major categories like housing, food, and transportation. [1] Bureau of Labor Statistics. "Consumer Expenditures in 2025," Accessed on July 10th, 2026. https://www.bls.gov/news.release/cesan.htm
To better understand how households manage their finances, a survey conducted on behalf of Self Financial asked 1,627 adults about their budgeting habits, spending priorities, and the emotional impact it has on their lives.
Key statistics
- Housing is the largest expense for American households, making up 33.4% of total spending in the Bureau of Labor Statistics (BLS) Consumer Expenditure Survey, based on 2024 data.
- The 2026 survey results revealed that rent (44.1%) and mortgage payments (38.4%) are among the top three expenses households spend most of their budget on each year.
- Food expenses make up 12.9% of annual household spending in the BLS Consumer Expenditure Survey. While more households spend more on home cooking (36.6%) than dining out (31.6%), the gap between the two has narrowed since 2025.
- Zero-Based Budgeting is the most popular budgeting method, used by 78.2% of those who apply a specific budgeting strategy, according to the 2026 survey results.
- The survey on behalf of Self Financial showed that when deciding what to cut from their budget first, respondents were least likely to cut personal care (31.2%), with savings and entertainment tied (34.4%) as the most likely to be cut first.
The average American household budget
According to the Bureau of Labor Statistics (BLS) Consumer Expenditure Survey, the average U.S. household spent $78,535 in 2024, reflecting a 1.8% rise from the previous year. The BLS also reports that the average household income before tax was $104,207 in 2024, a 2.4% increase from the prior year. [1] Bureau of Labor Statistics. "Consumer Expenditures in 2025," Accessed on July 10th, 2026. https://www.bls.gov/news.release/cesan.htm
Spending rose across most major categories, including housing, transportation, food, and personal insurance, indicating that many households face higher costs in essential areas.
Housing costs
Housing remains the largest household expenditure, making up 33.4% of total spending reported in 2024. This includes all housing-related expenses such as rent, mortgage payments, utilities, energy, home maintenance, lodging, furniture, and appliances. [1] Bureau of Labor Statistics. "Consumer Expenditures in 2025," Accessed on July 10th, 2026. https://www.bls.gov/news.release/cesan.htm According to a 2026 survey conducted on behalf of Self Financial, housing costs remain the biggest expenditure for respondents with rent costs (44.1%), mortgage payments (38.4%), and house maintenance (31.3%) taking the biggest portion of household budgets. A 2023 study on behalf of Self found that the average American can expect to pay $333,065 over a lifetime of renting, inclusive of bills and additional expenses.
| Biggest household expenses, by share of respondents | |
|---|---|
| Household expense | Percentage of respondents (%) |
| Rent costs | 44.1% |
| Mortgage payments | 38.4% |
| Housing maintenance | 31.3% |
| Utilities (electricity, water, trash, etc.) | 28.6% |
| Groceries (ingredients to cook at home) | 24% |
| Education | 19.5% |
| Leisure (streaming, dining out, visiting the movies, coffee, visiting a bar, etc.) | 17.9% |
| Personal Care (haircuts, salons, gym memberships, etc.) | 17.9% |
| Other | 17.8% |
| Transportation | 17.3% |
| Vacation | 17.1% |
| Clothing | 17% |

Data note: Respondents selected the three household expenses that account for the largest share of their budget.
For homeowners with a mortgage, borrowing costs have remained elevated in recent years because of higher interest rates. The average rate for a 30-year fixed-rate mortgage was 6.62% in January 2024 and peaked at 7.22% in May 2024. More recent data shows rates averaging 6.23% year to date as of May 2026, although they remain well above the historically low rates seen in previous years. [2] Freddie Mac. "Primary Mortgage Market Survey® (PMMS®)" Accessed on July 10th, 2026. https://www.freddiemac.com/pmms
Food, transportation, and healthcare expenses
Food, transportation, and healthcare are among the most significant costs in household budgets.
According to the BLS Consumer Expenditure Survey based on 2024 data, food expenses totaled $10,169 per household on average, accounting for 12.9% of annual expenditures, including the cost of both groceries ($6,224) and dining out ($3,945). [1] Bureau of Labor Statistics. "Consumer Expenditures in 2025," Accessed on July 10th, 2026. https://www.bls.gov/news.release/cesan.htm According to the survey, 36.6% of respondents spend more of their monthly food budget on home cooking (groceries and meal prep), while 31.6% spend more on dining out (restaurants, takeaways, and coffee shops), and 31.8% report spending about equally on both. This marks a notable shift from the 2025 survey on behalf of Self, when a majority (59.3%) said most of their food budget went toward cooking at home, compared to less than a quarter (24.7%) who spent the majority on dining out.
| Spending on dining out vs home cooking | |
|---|---|
| What people spend more on per month | Percentage of respondents |
| Home Cooking (groceries, meal prep', ingredients to cook at home) | 36.6% |
| About equal | 31.8% |
| Dining Out (restaurants, takeaways, coffee shops, etc.) | 31.6% |
Transportation remained another high-cost category, consuming 17% of total spending – with households spending an average of $13,318 in 2024, according to the latest Bureau of Labor Statistics (BLS) Consumer Expenditure Survey. This includes expenses on vehicles, fuel, train tickets, and other modes of transport. [1] Bureau of Labor Statistics. "Consumer Expenditures in 2025," Accessed on July 10th, 2026. https://www.bls.gov/news.release/cesan.htm
Healthcare costs also saw an increase in 2024 with households spending an average of $6,197 compared to $6,159 in 2023. [1] Bureau of Labor Statistics. "Consumer Expenditures in 2025," Accessed on July 10th, 2026. https://www.bls.gov/news.release/cesan.htm
Lifestyle and leisure spending
While essential costs such as housing and food take up much of the average household budget, there’s an average of $3,609 spent on entertainment costs per year, according to the BLS Consumer Expenditure Survey.
Other lifestyle-related costs include $2,001 on apparel and services, and $978 on personal care products and services, such as haircuts, salon treatments, and toiletries. Alcoholic beverages also accounted for $643 in spending on average. [1] Bureau of Labor Statistics. "Consumer Expenditures in 2025," Accessed on July 10th, 2026. https://www.bls.gov/news.release/cesan.htm
14.8% have no money left over after essentials
In the 2026 survey conducted on behalf of Self Financial, respondents were asked how much money they had after paying for key essentials including housing, food, utilities, and debt. This gives us an idea of how much money households have left over after covering their necessary payments.
Survey results showed that 14.8% of respondents reported having no money left after covering essentials such as taxes, housing, utilities, food, and debt, more (by +2.6%) than when the survey was last conducted in 2025. Showing how many live paycheck to paycheck, as a recent study confirmed with the majority (88.7%) relying on their next paycheck at least once in the last 12 months. Over one in five (21.2%) always run out of money before the next paycheck, 19.9% often run out of money, while 19.5% rarely run out before their next paycheck, 20.7% sometimes run out and 18.7% never do.
A further 15.2% had between $1–$250 left each month, 15.9% had $251–$500, 12.4% had $501–$1,000, 13.5% had $1,001–$1,500, 12.7% had $1,501–$2,000, and 15.5% had $2,001 or more left over after essential expenses.
Households who reported less than $20,000 in 2026 had the highest share reporting no money left after covering essentials, with 20.1% breaking even or running out by the end of the month. Among households earning over $100,000, the largest share (42.9%) had between $1,001–$1,500 left over after covering essential expenses each month.
How households budget and prioritize their spending
Households take different approaches when managing their finances, from detailed planning to more informal ways of tracking. The 2026 survey found that the majority (69.1%) of respondents budget at least sometimes, with 35.5% saying they always budget and 33.6% saying that they sometimes budget, while nearly a third (30.8%) never budget.
| How many people create a budget | |
|---|---|
| Do respondents create a budget before receiving their income | Percentage of respondents |
| Always | 35.5% |
| Sometimes | 33.6% |
| Never | 30.8% |
More than half (50.4%) include savings in their budget
Respondents were asked whether or not they put money aside for savings as part of their budget. Over half (50.4%) of those Self surveyed include savings as part of their budget. There was almost an even-split, with under half (49.6%) saying they don’t include savings in their budget.
The amount of savings that respondents have largely varies with 18.7% unable to cover one month of expenses with their current savings. The rest was spread almost evenly, with 20.7% being able to cover one to two months, 20% being able to cover three, and 20.9% being able to cover six to 11 months, showing how it varies by person.
Millennials are most likely to budget for savings
Saving habits across different age groups vary, with millennials (29-44) being the most likely to consider saving, with a 54.1% share of millennials saying they include savings as part of their budget. In contrast, Gen Z (18-28) are the least likely, with just over half (47.7%) setting aside money specifically for savings. Around half of older generations also account for savings as part of their budget, with baby boomers (61-70) and the silent generation (71+) saving at a similar rate (49.6% and 50.3%, respectively).
Zero-based budgeting is the most popular method
Of those that use a budgeting method, zero-based budgeting (ZBB) led the way. According to the 2026 survey data, 78.2% of respondents use this method, where every dollar is allocated to a specific expense, or savings.
| Most commonly used budgeting methods | |
|---|---|
| Budgeting method | Percentage of respondents (%) |
| Zero Budgeting Method (ZBB) | 78.2% |
| 50/30/20 Rule | 75.1% |
| Envelope System | 68.9% |
| Pay Yourself First | 63.6% |
| Do not use budgeting methods | 0.6% |
| Other budgeting methods | 0.2% |
Data note: Respondents could choose more than one budgeting method.
Other budgeting methods used included the Envelope System, a cash-based method with spending categories, each with an assigned envelope. Cash is budgeted and placed into each envelope, once an envelope is empty, no more spending is allowed in that category. Another budgeting option, the Pay Yourself First method, is when saving contributions are prioritized and put away before accounting for expenses.
How different generations budget
Different generations budget differently with some always budgeting, while others sometimes, or never budget.
As part of the 2026 survey, respondents were asked if they create a monthly household budget, with the choice of always, sometimes, and never. Here’s a look at what percentage of each generation creates a budget.
| How different generations budget | |||
|---|---|---|---|
| Generation | Always budget | Sometimes budget | Never budget |
| Gen Z (18–28) | Always budget 31.8% | Sometimes budget 30.0% | Never budget 38.2% |
| Millennials (29–44) | Always budget 37.6% | Sometimes budget 38.2% | Never budget 24.1% |
| Generation X (45–60) | Always budget 37.6% | Sometimes budget 29.5% | Never budget 32.9% |
| Baby boomers (61–70) | Always budget 33.7% | Sometimes budget 34.1% | Never budget 32.2% |
| Silent generation (71+) | Always budget 36.0% | Sometimes budget 34.0% | Never budget 29.9% |
Millennials and Gen X are the most likely to budget, with 37.6% reporting they always create a monthly budget – the highest of any generation. The silent generation follows closely behind, with 36% saying they always budget.
Gen Z has the lowest percentage of respondents who always budget (31.8%), but the highest rate of “sometimes” budgeting. This suggests that while they may not budget consistently, many younger adults are at least attempting to plan their expenses on a regular basis.
Millennials were most likely to budget in some form, with 75.8% saying that they always or sometimes create a monthly budget, and 24.1% saying they never do.
In general, “sometimes” was the most common response across all generations, but the differences in those that answered “always” and “never” help highlight which generations are most consistent and which are more likely to skip budgeting entirely.
How couples budget together
Staying on top of a household budget can be challenging, and while most households take some approach to budgeting, more than one in three (30.8%) do not budget at all, according to the 2026 survey data. For couples, financial planning can add another layer of complexity, requiring collaboration in managing income and expenses.
The most common approach among couples is to combine their income and budget together, with 23.3% doing so, while many others (21.3%) keep their finances separate but discuss budgeting together. Just under one in five (19.2%) split bills but manage personal expenses separately, while 16.5% manage their budget completely separately from their partner.
| How couples manage their budget together | |
|---|---|
| Budget management approach | Percentage of respondents (%) |
| Combine income and budget together | 23.3% |
| Keep finances separate but discuss budgeting | 21.3% |
| Split bills but manage personal expenses separately | 19.2% |
| Don't talk about budgeting | 19.1% |
| Manage budget separately from partner | 16.5% |
The emotional side of budgeting and spending
Household budgeting isn’t just about numbers – it can also be also tied to emotional decisions and other outside factors.
Regardless of what contributes to how people spend, based on Self’s survey responses it’s clear that creating a budget can be a stressful task for many. The survey data highlights that financial planning could be a concern for many, with nearly half of all respondents expressing some level of worry around budgeting.
Nearly half (48.4%) of people worry about budgeting
According to the survey data, nearly half (48.4%) of respondents are worried about budgeting.Concerns about budgeting are now fairly evenly spread across generations, unlike in 2025, when Gen Z stood out with 81.4% expressing some level of worry. In the 2026 survey, worry levels sit close together across all age groups, ranging from 42.6% (Gen X) to 51.1% (Silent Generation), with Gen Z reporting 49.3%. The rise in financial anxiety seemingly aligns with rising costs of living and inflation, which have impacted household expenses across food and housing. [1] Bureau of Labor Statistics. "Consumer Expenditures in 2025," Accessed on July 10th, 2026. https://www.bls.gov/news.release/cesan.htm
Over a third of people prioritize entertainment over savings
When asked in 2026 which expense they would cut first out of entertainment (eating out, the movies, bars, and hobbies), savings, or personal care (hair, nails, gym membership, etc.) – over a third, 34.4% of respondents chose to cut savings and entertainment over personal care.
More than a third of women (35.6%) said that they’d cut entertainment out of their budget over personal care and savings. A stark contrast to men, who favored personal care over entertainment or savings – with 33.1% choosing to cut out entertainment.
What factors influence a person’s spending
Over 66.3% of Self’s survey respondents said that they felt guilt over spending decisions at least occasionally. Despite most respondents worrying about their budget, they’re still spending money on things they may regret; this could be down to numerous factors.
Of those surveyed, most attributed needs over ‘wants’, 56.5% of respondents cited this as the biggest nudge towards making a purchase, showing that it’s more a case of what’s required rather than recreational spending. This was followed by sales and discounts (54.5%), emotional state (41.2%), and convenience (40.1%) which all played into people spending.
| Influence on spending decisions | Percentage of respondents (%) |
|---|---|
| Needs over "wants" | 56.5% |
| Sales and Discounts | 54.5% |
| Emotional state | 41.2% |
| Convenience | 40.1% |
| Advertising | 25.4% |
| Social Pressure | 24.8% |
Data note: Respondents could choose more than one answer.
How budgeting stress impacts daily life
Money struggles in 2026 can affect people in different ways, with 99.4% of respondents admitting they worry are affected, reporting at least one impact of budgeting on their daily lives.
The survey found that increased stress, difficulty sleeping, and anxiety weren't uncommon. The majority, 89.3%, said that budgeting worries caused or increased stress. This was followed by other well-being impacts such as difficulty sleeping (88.1%) and causing or increasing anxiety (80.2%), while 75.3% said budgeting worries reduced their ability to work or focus, and the same share (75.3%) reported strained relationships with family or friends.
| Impact of worrying about budgeting | Percentage of respondents (%) |
|---|---|
| Caused or increased stress | 89.3% |
| Difficulty sleeping | 88.1% |
| Caused or increased anxiety | 80.2% |
| Reduced ability to work or focus | 75.3% |
| Strained relationships with family or friends | 75.3% |
| None of the above | 24.7% |
Data note: Respondents could choose more than one answer.
This highlights the impact that budgeting can have on people’s lives and how it varies from one person to the next.
Other answers available included other impacts such as strained relations, reduced ability to work or focus, they don’t worry about budgeting, or none of the previous.
Methodology
A survey was carried out on behalf of Self Financial in June 2026 which asked 1,627 U.S. adults about their household budgeting and spending habits, including income allocation, savings behavior, and worries around budgeting. The survey captured a cross-section of respondents by age, gender, and income.
The self-identified demographics of respondents were:
Gender
- Female: 51.9%
- Male: 48.1%
- Non-Binary: 0%
- Prefer not to say: 0%
Age
- 18 - 28: 18.1%
- 29 - 44: 24.7%
- 45 - 60: 19.6%
- 61 - 70: 20.4%
- 71+: 17.2%
Level of income
- Under $20,000: 19.9%
- $20,001 - $40,000: 19.4%
- $40,001 - $60,000: 20.5%
- $60,001 - $80,000: 20.5%
- $80,001 - $100,000: 18.9%
- Over $100,000: 0.9%
Sources
- [1] Bureau of Labor Statistics. "Consumer Expenditures in 2025," Accessed on July 10th, 2026. https://www.bls.gov/news.release/cesan.htm
- [2] Freddie Mac. "Primary Mortgage Market Survey® (PMMS®)" Accessed on July 10th, 2026. https://www.freddiemac.com/pmms