The Cost Of Thanksgiving Dinner Over Time
Thanksgiving is a special holiday, a time when families and loved ones come together to show gratitude for the things they have in life. It is a day rich in tradition, and none is more sacrosanct than Thanksgiving dinner. Traditionally served as turkey with all the trimmings, the feast is painstakingly prepared by the host and enjoyed by all the guests.
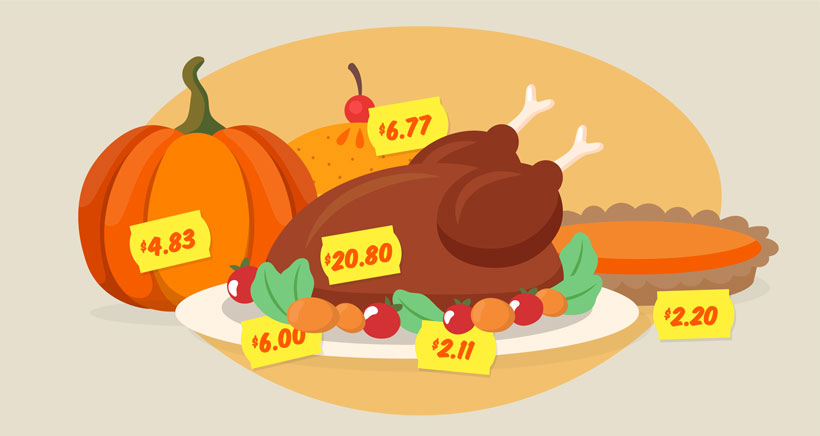
Over time, the cost of preparing and serving Thanksgiving dinner has changed. In 1960, this analysis found that a meal for 10 people cost just $15.63, but how much can you expect to pay today?
To find out, researchers on behalf of Self Financial analyzed the cost of ingredients dating back to the 1960s. Below you’ll see just how much the cost of a Thanksgiving dinner serving 10 has changed, and also which dishes have risen in price the most.
Key statistics
- The average cost of a Thanksgiving meal has increased by 966.3% between 1960 and 2025, from $15.63 to $166.69 for a meal for 10 people.
- The average cost of a Thanksgiving meal for 10 people has increased by 24% between 2023 to 2025, from $134.46 to $166.69 for a meal for 10 people.
- The price of cranberry sauce to serve 10 people has increased 2020.0% from 1960 to 2025, the highest out of any component ($0.25 to serve 10 people in 1960 versus $5.30 in 2025).
- A turkey to serve 10 people cost $31.60 more in 2025 than in 2023, the highest two-year increase out of any component.
The cost of Thanksgiving dinner since 1960
In 1960, the total cost of a Thanksgiving meal for 10 people cost an average of $15.63. Today, the cost of a 10-person celebratory feast has risen by 966.3%, costing the average host $166.69 in 2025.
In 2023, the cost would have been $134.46 for 10 people, however, due to the price of turkeys increasing from $25.40 in 2023 to $57 in 2025, this has meant 2025 is likely a more expensive year for Thanksgiving, by an increase of $32.23.
Fortunately, the rising meal costs have somewhat followed the same increase as the median U.S. household income, meaning comparatively, the increase doesn’t seem as drastic.
| Year | Thanksgiving dinner cost | Median household income |
|---|---|---|
| 1960 | $15.63 | $5,600 |
| 1961 | $16.13 | $5,700 |
| 1962 | $16.30 | $6,000 |
| 1963 | $16.48 | $6,200 |
| 1964 | $17.17 | $6,600 |
| 1965 | $17.52 | $6,900 |
| 1966 | $18.32 | $7,400 |
| 1967 | $18.42 | $7,200 |
| 1968 | $19.08 | $7,700 |
| 1969 | $20.13 | $9,400 |
| 1970 | $20.92 | $8,730 |
| 1971 | $21.47 | $10,290 |
| 1972 | $22.35 | $11,120 |
| 1973 | $25.06 | $10,500 |
| 1974 | $27.34 | $11,100 |
| 1975 | $29.40 | $13,720 |
| 1976 | $31.41 | $14,960 |
| 1977 | $32.84 | $13,570 |
| 1978 | $34.72 | $15,060 |
| 1979 | $34.81 | $16,530 |
| 1980 | $43.85 | $21,020 |
| 1981 | $47.18 | $22,390 |
| 1982 | $48.93 | $23,430 |
| 1983 | $53.25 | $24,580 |
| 1984 | $54.77 | $22,420 |
| 1985 | $56.09 | $23,620 |
| 1986 | $61.27 | $24,900 |
| 1987 | $57.56 | $26,060 |
| 1988 | $59.94 | $27,230 |
| 1989 | $58.85 | $28,910 |
| 1990 | $56.65 | $29,940 |
| 1991 | $63.80 | $30,130 |
| 1992 | $64.78 | $30,640 |
| 1993 | $68.28 | $31,240 |
| 1994 | $67.03 | $32,260 |
| 1995 | $69.21 | $34,080 |
| 1996 | $72.54 | $35,490 |
| 1997 | $72.77 | $37,010 |
| 1998 | $80.18 | $38,890 |
| 1999 | $81.51 | $40,700 |
| 2000 | $79.59 | $41,990 |
| 2001 | $87.79 | $42,230 |
| 2002 | $88.08 | $42,410 |
| 2003 | $88.30 | $43,320 |
| 2004 | $91.62 | $44,300 |
| 2005 | $93.95 | $46,330 |
| 2006 | $94.41 | $48,200 |
| 2007 | $100.43 | $50,230 |
| 2008 | $107.75 | $50,300 |
| 2009 | $105.08 | $49,780 |
| 2010 | $105.37 | $49,280 |
| 2011 | $116.01 | $50,050 |
| 2012 | $118.10 | $51,020 |
| 2013 | $118.05 | $51,940 |
| 2014 | $119.50 | $53,660 |
| 2015 | $122.14 | $56,520 |
| 2016 | $119.61 | $59,040 |
| 2017 | $119.15 | $61,370 |
| 2018 | $120.55 | $63,180 |
| 2019 | $120.36 | $68,700 |
| 2020 | $121.22 | $68,010 |
| 2021 | $132.88 | $70,780 |
| 2022 | $140.41 | $74,580 |
| 2023 | $134.46 | $80,610 |
| 2024 | $166.69 | $83,730 |
Cost of Thanksgiving dishes: 1960 vs. 2025
Although the world is an entirely different place today compared to 1960, the core of a Thanksgiving meal still looks the same as it did back then. Traditions are retained for a reason, and it’s why Americans all over the country come together to enjoy their turkey feast.
This analysis dives deeper into each dish that comprises a traditional Thanksgiving meal. The data below highlights the price for each dish in 1960 and compares it to the average cost for the same dish today.
| Dish | Cost ($) in 1960 (serving 10 people) | Cost ($) in 2025 (serving 10 people) | Increase % |
|---|---|---|---|
| Turkey | $3.83 | $57 | 1390.2% |
| Mashed potatoes | $1.06 | $13.27 | 1157.1% |
| Cranberry sauce | $0.25 | $5.30 | 2020.0% |
| Stuffing | $0.78 | $12.45 | 1506.5% |
| Sweet potato casserole | $2.35 | $12.51 | 432.4% |
| Green bean casserole | $1.20 | $8.83 | 636.1% |
| Bread rolls | $0.35 | $4.05 | 1057.1% |
| Mac & cheese | $3.00 | $24.53 | 717.5% |
| Corn | $1.09 | $3.24 | 197.7% |
| Salad | $0.10 | $4.35 | 4250.0% |
| Pumpkin pie | $0.89 | $7.30 | 720.2% |
| Pecan pie | $0.75 | $13.86 | 1748.3% |
Cost of Thanksgiving dishes: 2023 vs. 2025
Overall, the cost of a Thanksgiving meal for 10 people has increased 24% since 2023 (from $134.46 to $166.69 in 2025).
Since 2023, the item that has increased most in cost is the centrepiece Turkey, which has since increased by $31.60 (or 124.4%) when serving 10 people. Pecan pie costs have increased the second most, from $8.31 to $13.86 (a 66.8% increase). The dish that has increased the third most in expense is cranberry sauce, which is up by $4.17 from $1.13 to $5.30.
But not all dishes cost more in 2025 than they did in 2023. Five dishes actually became less expensive in this time period when serving 10 people. Unlike pecan pie, pumpkin pie decreased by $2.37 in two years, from $9.67 to $7.30. Likewise, sweet potato casserole decreased by $6.09 and corn reduced by $5.06.
| Dish | Cost ($) in 2023 (serving 10 people) | Cost ($) in 2025 (serving 10 people) | Increase % |
|---|---|---|---|
| Turkey | $25.40 | $57 | +124.4% |
| Mashed potatoes | $12.48 | $13.27 | +6.3% |
| Cranberry sauce | $1.13 | $5.30 | +369.0% |
| Stuffing | $8.31 | $12.45 | +49.8% |
| Sweet potato casserole | $18.60 | $12.51 | -32.7% |
| Green bean casserole | $10.72 | $8.83 | -17.6% |
| Bread rolls | $3.60 | $4.05 | +12.5% |
| Mac & cheese | $26.65 | $24.53 | -8.0% |
| Corn | $8.30 | $3.24 | -61.0% |
| Salad | $1.29 | $4.35 | +237.9% |
| Pumpkin pie | $9.67 | $7.30 | -24.5% |
| Pecan pie | $8.31 | $13.86 | +66.8% |
Turkey
For many of us, the turkey is the star of the show and that’s certainly reflected in the prices paid in supermarkets today.
Back in 1960, a turkey to feed 10 people would cost $3.83. Today, that price is $57- an increase of more than 1390.2%.
| Year | Cost of turkey |
|---|---|
| 1960 | $3.83 |
| 1961 | $3.76 |
| 1962 | $3.85 |
| 1963 | $3.89 |
| 1964 | $3.95 |
| 1965 | $4.04 |
| 1966 | $4.24 |
| 1967 | $4.21 |
| 1968 | $4.38 |
| 1969 | $4.64 |
| 1970 | $4.76 |
| 1971 | $4.91 |
| 1972 | $5.20 |
| 1973 | $6.33 |
| 1974 | $7.09 |
| 1975 | $7.59 |
| 1976 | $7.54 |
| 1977 | $8.14 |
| 1978 | $9.10 |
| 1979 | $9.95 |
| 1980 | $11.05 |
| 1981 | $11.43 |
| 1982 | $11.74 |
| 1983 | $11.86 |
| 1984 | $12.33 |
| 1985 | $12.50 |
| 1986 | $17.80 |
| 1987 | $13.60 |
| 1988 | $14.80 |
| 1989 | $13.46 |
| 1990 | $16.05 |
| 1991 | $13.34 |
| 1992 | $13.81 |
| 1993 | $16.94 |
| 1994 | $15.00 |
| 1995 | $15.85 |
| 1996 | $16.83 |
| 1997 | $16.84 |
| 1998 | $17.14 |
| 1999 | $17.79 |
| 2000 | $15.65 |
| 2001 | $18.91 |
| 2002 | $18.55 |
| 2003 | $19.34 |
| 2004 | $17.79 |
| 2005 | $18.89 |
| 2006 | $19.63 |
| 2007 | $22.04 |
| 2008 | $23.86 |
| 2009 | $23.31 |
| 2010 | $22.08 |
| 2011 | $26.96 |
| 2012 | $27.79 |
| 2013 | $27.20 |
| 2014 | $27.06 |
| 2015 | $28.80 |
| 2016 | $28.43 |
| 2017 | $27.98 |
| 2018 | $27.14 |
| 2019 | $26.00 |
| 2020 | $24.24 |
| 2021 | $29.99 |
| 2022 | $36.20 |
| 2023 | $25.40 |
| 2025 | $57.00 |
Mashed potatoes
Mashed potatoes are a staple for over half of U.S. homes on Thanksgiving, [1] YouGov, ‘What Americans plan to eat for Thanksgiving’ https://today.yougov.com/society/articles/50983-poll-what-americans-plan-to-eat-thanksgiving and have increased in price even faster than turkeys have. The cost of mashed potatoes saw a sharp increase of 1157.1% in price since the 1960s, with the dish now costing $13.27, up from $1.06 in 1960 when serving 10 people.
The recipe is traditionally made from potatoes, butter, and half-and-half. However, because the prices for half-and-half weren’t available in the 1960s, the recipe in this study was substituted with milk.
| Year | Cost of mashed potatoes |
|---|---|
| 1960 | $1.06 |
| 1961 | $1.00 |
| 1962 | $1.00 |
| 1963 | $1.01 |
| 1964 | $1.09 |
| 1965 | $1.19 |
| 1966 | $1.12 |
| 1967 | $1.13 |
| 1968 | $1.19 |
| 1969 | $1.24 |
| 1970 | $1.32 |
| 1971 | $1.20 |
| 1972 | $1.36 |
| 1973 | $1.62 |
| 1974 | $1.89 |
| 1975 | $1.72 |
| 1976 | $1.82 |
| 1977 | $1.86 |
| 1978 | $1.84 |
| 1979 | $1.89 |
| 1980 | $2.27 |
| 1981 | $2.44 |
| 1982 | $2.46 |
| 1983 | $2.47 |
| 1984 | $2.51 |
| 1985 | $2.50 |
| 1986 | $2.52 |
| 1987 | $2.58 |
| 1988 | $2.58 |
| 1989 | $2.73 |
| 1990 | $2.82 |
| 1991 | $2.72 |
| 1992 | $2.67 |
| 1993 | $2.60 |
| 1994 | $2.63 |
| 1995 | $2.63 |
| 1996 | $3.01 |
| 1997 | $3.09 |
| 1998 | $4.68 |
| 1999 | $4.72 |
| 2000 | $4.58 |
| 2001 | $5.12 |
| 2002 | $4.92 |
| 2003 | $4.77 |
| 2004 | $5.57 |
| 2005 | $5.49 |
| 2006 | $5.20 |
| 2007 | $5.71 |
| 2008 | $6.16 |
| 2009 | $5.24 |
| 2010 | $5.53 |
| 2011 | $6.19 |
| 2012 | $5.97 |
| 2013 | $5.92 |
| 2014 | $6.20 |
| 2015 | $5.93 |
| 2016 | $5.77 |
| 2017 | $5.86 |
| 2018 | $5.77 |
| 2019 | $5.89 |
| 2020 | $5.89 |
| 2021 | $10.11 |
| 2022 | $11.83 |
| 2023 | $12.48 |
| 2025 | $13.27 |
Recipe used: The Kitchn, Mashed Potatoes
Cranberry sauce
Homemade cranberry sauce is a highlight for many on the Thanksgiving table, and the recipe in this analysis called for 1lb of cranberries, a cup of white sugar, and a cup of freshly squeezed orange juice.
This year, the average cost has reached its highest-ever price at an average of $5.30 for a 10-person serving. This is a 369% increase from the 2023 cost of $1.13, which at the time was already the costliest it had ever been.
This is because while the price of a cup of orange juice has increased from $0.67 to $0.69, the cost of cranberries per pound has increased from $1.54 to $4.15.
| Year | Cost of cranberry sauce |
|---|---|
| 1960 | $0.25 |
| 1961 | $0.25 |
| 1962 | $0.26 |
| 1963 | $0.26 |
| 1964 | $0.26 |
| 1965 | $0.26 |
| 1966 | $0.27 |
| 1967 | $0.27 |
| 1968 | $0.29 |
| 1969 | $0.30 |
| 1970 | $0.32 |
| 1971 | $0.34 |
| 1972 | $0.35 |
| 1973 | $0.36 |
| 1974 | $0.38 |
| 1975 | $0.43 |
| 1976 | $0.48 |
| 1977 | $0.50 |
| 1978 | $0.54 |
| 1979 | $0.48 |
| 1980 | $0.66 |
| 1981 | $0.75 |
| 1982 | $0.20 |
| 1983 | $0.22 |
| 1984 | $0.22 |
| 1985 | $0.23 |
| 1986 | $0.25 |
| 1987 | $0.25 |
| 1988 | $0.25 |
| 1989 | $0.27 |
| 1990 | $0.29 |
| 1991 | $0.30 |
| 1992 | $0.31 |
| 1993 | $0.32 |
| 1994 | $0.32 |
| 1995 | $0.34 |
| 1996 | $0.34 |
| 1997 | $0.36 |
| 1998 | $0.55 |
| 1999 | $0.56 |
| 2000 | $0.57 |
| 2001 | $0.58 |
| 2002 | $0.57 |
| 2003 | $0.57 |
| 2004 | $0.58 |
| 2005 | $0.59 |
| 2006 | $0.69 |
| 2007 | $0.71 |
| 2008 | $0.71 |
| 2009 | $0.74 |
| 2010 | $0.79 |
| 2011 | $0.83 |
| 2012 | $0.84 |
| 2013 | $0.81 |
| 2014 | $0.83 |
| 2015 | $0.84 |
| 2016 | $0.84 |
| 2017 | $0.87 |
| 2018 | $0.88 |
| 2019 | $0.88 |
| 2020 | $0.89 |
| 2021 | $0.99 |
| 2022 | $1.07 |
| 2023 | $1.13 |
| 2025 | $5.30 |
Recipe used: Allrecipes, Cranberry Sauce
Stuffing
Stuffing is another one of those dishes that crosses state borders and will typically be on the dinner tables for over 50% of the U.S. [1] YouGov, ‘What Americans plan to eat for Thanksgiving’ https://today.yougov.com/society/articles/50983-poll-what-americans-plan-to-eat-thanksgiving This research analyzed the cost of traditional stuffing, including bread, eggs, onion, herbs, and a homemade broth substitute.
Butter has seen one of the most dramatic price increases of all the ingredients for 10 people, jumping by almost 2405% since 1960. In the 2023 update, eggs had seen one of the slowest price increases, rising from $0.05 to $0.26 per egg between 1960 and 2023. However, since 2023, prices have increased to $0.68 per egg – a 161.5% increase.
Overall, the ingredient price increases have meant the cost of Thanksgiving stuffing has increased more than 1506% since 1960, rising from $0.78 to $12.45 in 2025.
| Year | Cost of stuffing |
|---|---|
| 1960 | $0.78 |
| 1961 | $0.79 |
| 1962 | $0.80 |
| 1963 | $0.81 |
| 1964 | $0.83 |
| 1965 | $0.84 |
| 1966 | $0.89 |
| 1967 | $0.88 |
| 1968 | $0.90 |
| 1969 | $0.96 |
| 1970 | $0.99 |
| 1971 | $1.01 |
| 1972 | $1.03 |
| 1973 | $1.15 |
| 1974 | $1.28 |
| 1975 | $1.33 |
| 1976 | $1.35 |
| 1977 | $1.40 |
| 1978 | $1.45 |
| 1979 | $1.58 |
| 1980 | $2.86 |
| 1981 | $3.04 |
| 1982 | $3.00 |
| 1983 | $3.08 |
| 1984 | $3.16 |
| 1985 | $3.20 |
| 1986 | $2.91 |
| 1987 | $2.91 |
| 1988 | $3.00 |
| 1989 | $3.14 |
| 1990 | $3.10 |
| 1991 | $3.11 |
| 1992 | $3.09 |
| 1993 | $3.01 |
| 1994 | $3.00 |
| 1995 | $3.09 |
| 1996 | $3.58 |
| 1997 | $3.66 |
| 1998 | $4.15 |
| 1999 | $4.05 |
| 2000 | $4.04 |
| 2001 | $4.70 |
| 2002 | $4.63 |
| 2003 | $4.50 |
| 2004 | $4.99 |
| 2005 | $4.95 |
| 2006 | $4.81 |
| 2007 | $5.18 |
| 2008 | $5.56 |
| 2009 | $5.38 |
| 2010 | $5.58 |
| 2011 | $6.06 |
| 2012 | $5.96 |
| 2013 | $5.98 |
| 2014 | $6.08 |
| 2015 | $6.33 |
| 2016 | $6.16 |
| 2017 | $6.18 |
| 2018 | $6.55 |
| 2019 | $6.50 |
| 2020 | $6.54 |
| 2021 | $6.74 |
| 2022 | $7.70 |
| 2023 | $8.31 |
| 2025 | $12.45 |
Sweet potato casserole
Although marshmallows are a custom of the sweet potato casserole, they weren’t always as available as they are today, and in fact, have traditionally made up the costliest part of making the dish when using the raw ingredients.
The dish itself is typically made from sweet potatoes, brown sugar, butter, vanilla extract, milk, eggs, mini marshmallows (made from egg white, corn syrup, sugar, and vanilla extract), and chopped pecans.
Overall, to feed 10 people in 2025, the cost of making a sweet potato casserole from scratch will set you back $12.51. That’s compared to just $2.35 in 1960.
| Year | Cost of sweet potato casserole |
|---|---|
| 1960 | $2.35 |
| 1961 | $2.39 |
| 1962 | $2.43 |
| 1963 | $2.45 |
| 1964 | $2.46 |
| 1965 | $2.49 |
| 1966 | $2.58 |
| 1967 | $2.60 |
| 1968 | $2.69 |
| 1969 | $2.83 |
| 1970 | $2.94 |
| 1971 | $3.10 |
| 1972 | $3.21 |
| 1973 | $3.40 |
| 1974 | $3.60 |
| 1975 | $3.99 |
| 1976 | $4.38 |
| 1977 | $4.59 |
| 1978 | $4.91 |
| 1979 | $5.28 |
| 1980 | $6.44 |
| 1981 | $7.28 |
| 1982 | $7.98 |
| 1983 | $8.44 |
| 1984 | $8.74 |
| 1985 | $8.98 |
| 1986 | $9.36 |
| 1987 | $9.53 |
| 1988 | $9.88 |
| 1989 | $10.31 |
| 1990 | $10.78 |
| 1991 | $11.28 |
| 1992 | $11.61 |
| 1993 | $11.91 |
| 1994 | $12.21 |
| 1995 | $12.61 |
| 1996 | $13.18 |
| 1997 | $13.59 |
| 1998 | $14.16 |
| 1999 | $14.35 |
| 2000 | $14.58 |
| 2001 | $15.26 |
| 2002 | $15.64 |
| 2003 | $15.91 |
| 2004 | $16.50 |
| 2005 | $16.85 |
| 2006 | $17.30 |
| 2007 | $17.96 |
| 2008 | $18.66 |
| 2009 | $19.14 |
| 2010 | $19.36 |
| 2011 | $19.99 |
| 2012 | $20.51 |
| 2013 | $20.84 |
| 2014 | $21.11 |
| 2015 | $21.71 |
| 2016 | $21.53 |
| 2017 | $21.75 |
| 2018 | $22.34 |
| 2019 | $22.63 |
| 2020 | $24.19 |
| 2021 | $24.55 |
| 2022 | $17.41 |
| 2023 | $18.60 |
| 2025 | $12.51 |
Recipe used: Delish, Sweet Potato Casserole With Marshmallows
Green bean casserole
The humble green bean casserole has risen from $1.20 in 1960 to $8.83 in 2025 — an increase of 636.1%. In 2023, a green bean casserole cost $10.72 for ten people, a 17.6% decrease in 2025.
The traditional recipe is made from canned green beans, fresh fried onions, cheddar cheese, and mushroom soup, but the condensed cream of mushroom soup can be substituted with white sauce made from butter, flour, and milk.
| Year | Cost of green bean casserole |
|---|---|
| 1960 | $1.20 |
| 1961 | $1.72 |
| 1962 | $1.73 |
| 1963 | $1.75 |
| 1964 | $1.85 |
| 1965 | $1.88 |
| 1966 | $1.97 |
| 1967 | $2.00 |
| 1968 | $2.05 |
| 1969 | $2.12 |
| 1970 | $2.17 |
| 1971 | $2.22 |
| 1972 | $2.27 |
| 1973 | $2.38 |
| 1974 | $2.52 |
| 1975 | $3.05 |
| 1976 | $3.25 |
| 1977 | $3.32 |
| 1978 | $3.35 |
| 1979 | $3.28 |
| 1980 | $3.82 |
| 1981 | $3.90 |
| 1982 | $4.22 |
| 1983 | $4.75 |
| 1984 | $4.80 |
| 1985 | $5.38 |
| 1986 | $4.73 |
| 1987 | $4.75 |
| 1988 | $4.82 |
| 1989 | $4.98 |
| 1990 | $3.97 |
| 1991 | $5.53 |
| 1992 | $5.55 |
| 1993 | $5.93 |
| 1994 | $5.95 |
| 1995 | $5.97 |
| 1996 | $5.97 |
| 1997 | $6.47 |
| 1998 | $6.90 |
| 1999 | $7.02 |
| 2000 | $7.05 |
| 2001 | $7.70 |
| 2002 | $7.75 |
| 2003 | $7.63 |
| 2004 | $7.92 |
| 2005 | $8.47 |
| 2006 | $8.38 |
| 2007 | $8.50 |
| 2008 | $9.30 |
| 2009 | $9.13 |
| 2010 | $9.22 |
| 2011 | $9.65 |
| 2012 | $10.22 |
| 2013 | $10.20 |
| 2014 | $10.28 |
| 2015 | $10.18 |
| 2016 | $10.12 |
| 2017 | $10.48 |
| 2018 | $10.58 |
| 2019 | $10.72 |
| 2020 | $10.98 |
| 2021 | $11.55 |
| 2022 | $12.38 |
| 2023 | $10.72 |
| 2025 | $8.83 |
Recipe used: Allrecipes, Green Bean Casserole
Bread rolls
Bread rolls are typically one of the more affordable aspects of the Thanksgiving feast. The ingredients in a typical recipe are milk, yeast, all-purpose flour, butter and egg; and this research analyzed the cost of Red Star Platinum yeast for this recipe; however, baking powder also works as an excellent substitute.
Overall, the cost to make a batch of bread rolls for 10 people has soared by more than 1057.1%, costing just $0.35 in 1960 but rising to $4.05 today.
| Year | Cost of bread rolls |
|---|---|
| 1960 | $0.35 |
| 1961 | $0.35 |
| 1962 | $0.35 |
| 1963 | $0.35 |
| 1964 | $0.35 |
| 1965 | $0.35 |
| 1966 | $0.36 |
| 1967 | $0.36 |
| 1968 | $0.38 |
| 1969 | $0.40 |
| 1970 | $0.41 |
| 1971 | $0.43 |
| 1972 | $0.43 |
| 1973 | $0.48 |
| 1974 | $0.50 |
| 1975 | $0.54 |
| 1976 | $0.58 |
| 1977 | $0.60 |
| 1978 | $0.63 |
| 1979 | $0.53 |
| 1980 | $1.00 |
| 1981 | $1.10 |
| 1982 | $1.15 |
| 1983 | $1.20 |
| 1984 | $1.24 |
| 1985 | $1.25 |
| 1986 | $1.28 |
| 1987 | $1.30 |
| 1988 | $1.33 |
| 1989 | $1.39 |
| 1990 | $1.44 |
| 1991 | $1.46 |
| 1992 | $1.46 |
| 1993 | $1.48 |
| 1994 | $1.50 |
| 1995 | $1.54 |
| 1996 | $1.66 |
| 1997 | $1.71 |
| 1998 | $2.01 |
| 1999 | $2.01 |
| 2000 | $2.01 |
| 2001 | $2.18 |
| 2002 | $2.18 |
| 2003 | $2.18 |
| 2004 | $2.35 |
| 2005 | $2.36 |
| 2006 | $2.34 |
| 2007 | $2.51 |
| 2008 | $2.80 |
| 2009 | $2.65 |
| 2010 | $2.69 |
| 2011 | $2.89 |
| 2012 | $2.88 |
| 2013 | $2.90 |
| 2014 | $2.98 |
| 2015 | $3.00 |
| 2016 | $2.91 |
| 2017 | $2.89 |
| 2018 | $2.91 |
| 2019 | $2.89 |
| 2020 | $2.91 |
| 2021 | $2.93 |
| 2022 | $3.41 |
| 2023 | $3.60 |
| 2025 | $4.05 |
Recipe used: Sally’s Baking Addiction, Soft Dinner Rolls
Mac & cheese
Another well-established favorite, mac & cheese has been featured on many Thanksgiving dinner tables for decades. However, this research opted to use a homemade recipe to maintain consistency with the 1960s because pasta hasn’t always been as accessible to consumers as it is today.
However, this still hasn’t prevented the price overall from surging by 717.5% since 1960. While a dish for 10 people would have cost an estimated $3 in 1960, the same dish is now priced at $24.53.
| Year | Cost of mac & cheese |
|---|---|
| 1960 | $3.00 |
| 1961 | $3.04 |
| 1962 | $3.04 |
| 1963 | $3.08 |
| 1964 | $3.49 |
| 1965 | $3.55 |
| 1966 | $3.85 |
| 1967 | $3.93 |
| 1968 | $4.05 |
| 1969 | $4.31 |
| 1970 | $4.55 |
| 1971 | $4.68 |
| 1972 | $4.83 |
| 1973 | $5.39 |
| 1974 | $5.89 |
| 1975 | $6.21 |
| 1976 | $7.08 |
| 1977 | $7.31 |
| 1978 | $7.44 |
| 1979 | $6.69 |
| 1980 | $7.60 |
| 1981 | $8.20 |
| 1982 | $8.45 |
| 1983 | $11.01 |
| 1984 | $11.26 |
| 1985 | $11.33 |
| 1986 | $11.39 |
| 1987 | $11.44 |
| 1988 | $11.79 |
| 1989 | $10.53 |
| 1990 | $5.76 |
| 1991 | $13.23 |
| 1992 | $13.28 |
| 1993 | $12.89 |
| 1994 | $13.00 |
| 1995 | $13.25 |
| 1996 | $13.45 |
| 1997 | $13.58 |
| 1998 | $15.18 |
| 1999 | $15.63 |
| 2000 | $15.74 |
| 2001 | $16.71 |
| 2002 | $17.16 |
| 2003 | $16.71 |
| 2004 | $18.01 |
| 2005 | $18.28 |
| 2006 | $18.01 |
| 2007 | $18.64 |
| 2008 | $20.49 |
| 2009 | $19.93 |
| 2010 | $20.18 |
| 2011 | $22.26 |
| 2012 | $22.76 |
| 2013 | $22.75 |
| 2014 | $23.00 |
| 2015 | $22.96 |
| 2016 | $22.13 |
| 2017 | $21.36 |
| 2018 | $22.13 |
| 2019 | $22.38 |
| 2020 | $22.93 |
| 2021 | $22.99 |
| 2022 | $25.54 |
| 2023 | $26.65 |
| 2025 | $24.53 |
Recipe used: The Chunky Chef, Creamy Baked Mac & Cheese
Creamed corn
The price of corn and cream cheese to make delicious creamed corn has seen an increase of more than 197.7% since the 1960s.
The cost to make this dish today is $3.24 to serve 10 people, considerably higher than the $1.09 in 1960. In 2023, this dish cost $8.30 to make for 10 people, $5.06 more than it costs in 2025. This higher 2023 cost was likely due to the cost of corn increasing after a dry summer that year, leading to a poor harvest. [2] Mc Graw Hill, ‘Corn Prices Have Popped’ https://www.mheducation.com/highered/blog/2024/04/corn-prices-have-popped
This research based its analysis on a recipe using homemade cream cheese (made from milk and lemon juice).
| Year | Cost of creamed corn |
|---|---|
| 1960 | $1.09 |
| 1961 | $1.09 |
| 1962 | $1.09 |
| 1963 | $1.13 |
| 1964 | $1.14 |
| 1965 | $1.14 |
| 1966 | $1.19 |
| 1967 | $1.20 |
| 1968 | $1.26 |
| 1969 | $1.31 |
| 1970 | $1.36 |
| 1971 | $1.44 |
| 1972 | $1.49 |
| 1973 | $1.54 |
| 1974 | $1.66 |
| 1975 | $1.79 |
| 1976 | $1.96 |
| 1977 | $2.04 |
| 1978 | $2.18 |
| 1979 | $1.78 |
| 1980 | $2.66 |
| 1981 | $2.98 |
| 1982 | $3.28 |
| 1983 | $3.48 |
| 1984 | $3.55 |
| 1985 | $3.68 |
| 1986 | $3.76 |
| 1987 | $3.86 |
| 1988 | $3.99 |
| 1989 | $4.21 |
| 1990 | $4.46 |
| 1991 | $4.64 |
| 1992 | $4.78 |
| 1993 | $4.89 |
| 1994 | $5.06 |
| 1995 | $5.19 |
| 1996 | $5.19 |
| 1997 | $3.81 |
| 1998 | $4.58 |
| 1999 | $4.74 |
| 2000 | $4.71 |
| 2001 | $4.91 |
| 2002 | $4.91 |
| 2003 | $4.98 |
| 2004 | $5.25 |
| 2005 | $5.41 |
| 2006 | $5.46 |
| 2007 | $5.88 |
| 2008 | $6.14 |
| 2009 | $5.86 |
| 2010 | $5.95 |
| 2011 | $6.23 |
| 2012 | $6.29 |
| 2013 | $6.34 |
| 2014 | $6.55 |
| 2015 | $6.45 |
| 2016 | $6.31 |
| 2017 | $6.38 |
| 2018 | $6.31 |
| 2019 | $6.45 |
| 2020 | $6.66 |
| 2021 | $6.81 |
| 2022 | $7.85 |
| 2023 | $8.30 |
| 2025 | $3.24 |
Salad
Salad is one of the most difficult dishes to track the price of simply because what a salad has meant through time has transformed more rapidly than any other dish since the 1960s, while bagged salad wasn’t around until the early 80s. [3] epicurious, ‘How Bagged Salad Mix Took Over the Produce Section’ https://www.epicurious.com/ingredients/bagged-salad-history This meant historical prices of ‘salad’ and its core ingredients weren’t as available in this analysis, so instead, this piece has used lettuce as a proxy to allow people to add some extra greenery to their plate.
Moving from $0.10 per 10-person serving in 1960 to $4.35 in 2025, prices have shot up by 4250.0%, the largest increase in this analysis.
| Year | Cost of salad |
|---|---|
| 1960 | $0.10 |
| 1961 | $0.11 |
| 1962 | $0.11 |
| 1963 | $0.11 |
| 1964 | $0.11 |
| 1965 | $0.11 |
| 1966 | $0.11 |
| 1967 | $0.11 |
| 1968 | $0.11 |
| 1969 | $0.13 |
| 1970 | $0.13 |
| 1971 | $0.14 |
| 1972 | $0.15 |
| 1973 | $0.15 |
| 1974 | $0.15 |
| 1975 | $0.18 |
| 1976 | $0.19 |
| 1977 | $0.21 |
| 1978 | $0.21 |
| 1979 | $0.24 |
| 1980 | $0.28 |
| 1981 | $0.31 |
| 1982 | $0.34 |
| 1983 | $0.38 |
| 1984 | $0.38 |
| 1985 | $0.40 |
| 1986 | $0.40 |
| 1987 | $0.41 |
| 1988 | $0.44 |
| 1989 | $0.45 |
| 1990 | $0.48 |
| 1991 | $0.50 |
| 1992 | $0.53 |
| 1993 | $0.60 |
| 1994 | $0.55 |
| 1995 | $0.73 |
| 1996 | $0.59 |
| 1997 | $0.63 |
| 1998 | $0.69 |
| 1999 | $0.60 |
| 2000 | $0.66 |
| 2001 | $0.71 |
| 2002 | $0.78 |
| 2003 | $0.74 |
| 2004 | $0.73 |
| 2005 | $0.79 |
| 2006 | $0.79 |
| 2007 | $0.84 |
| 2008 | $0.83 |
| 2009 | $0.83 |
| 2010 | $0.79 |
| 2011 | $0.89 |
| 2012 | $0.78 |
| 2013 | $0.91 |
| 2014 | $0.95 |
| 2015 | $1.05 |
| 2016 | $0.96 |
| 2017 | $0.93 |
| 2018 | $0.85 |
| 2019 | $1.06 |
| 2020 | $1.08 |
| 2021 | $1.13 |
| 2022 | $1.21 |
| 2023 | $1.29 |
| 2025 | $4.35 |
Recipe used: Bon Appetit, Everyday Greens Salad
Pumpkin pie
Aside from the turkey, pumpkin pie is widely considered to be among the quintessential dishes of a Thanksgiving meal. Its simplicity and versatility as a dessert make it a go-to for people celebrating this holiday, particularly when serving for a party of 10.
As for the cost, in 1960 the price of making a pumpkin pie would cost $0.89. Today, that price has increased by 720.2% to $7.30 today. For ease of comparison, this research substituted pumpkins with pumpkin puree.
| Year | Cost of pumpkin pie |
|---|---|
| 1960 | $0.89 |
| 1961 | $0.89 |
| 1962 | $0.89 |
| 1963 | $0.90 |
| 1964 | $0.90 |
| 1965 | $0.91 |
| 1966 | $0.95 |
| 1967 | $0.94 |
| 1968 | $0.98 |
| 1969 | $1.03 |
| 1970 | $1.07 |
| 1971 | $1.10 |
| 1972 | $1.13 |
| 1973 | $1.23 |
| 1974 | $1.30 |
| 1975 | $1.41 |
| 1976 | $1.52 |
| 1977 | $1.57 |
| 1978 | $1.67 |
| 1979 | $1.57 |
| 1980 | $2.66 |
| 1981 | $2.94 |
| 1982 | $3.13 |
| 1983 | $3.26 |
| 1984 | $3.36 |
| 1985 | $3.40 |
| 1986 | $3.50 |
| 1987 | $3.54 |
| 1988 | $3.63 |
| 1989 | $3.79 |
| 1990 | $3.90 |
| 1991 | $3.99 |
| 1992 | $4.02 |
| 1993 | $4.04 |
| 1994 | $4.10 |
| 1995 | $4.21 |
| 1996 | $4.56 |
| 1997 | $4.70 |
| 1998 | $5.36 |
| 1999 | $5.36 |
| 2000 | $5.34 |
| 2001 | $5.80 |
| 2002 | $5.80 |
| 2003 | $5.80 |
| 2004 | $6.29 |
| 2005 | $6.29 |
| 2006 | $6.27 |
| 2007 | $6.65 |
| 2008 | $7.06 |
| 2009 | $6.82 |
| 2010 | $6.99 |
| 2011 | $7.43 |
| 2012 | $7.46 |
| 2013 | $7.51 |
| 2014 | $7.66 |
| 2015 | $7.82 |
| 2016 | $7.60 |
| 2017 | $7.62 |
| 2018 | $7.84 |
| 2019 | $7.82 |
| 2020 | $7.86 |
| 2021 | $7.99 |
| 2022 | $9.09 |
| 2023 | $9.67 |
| 2025 | $7.30 |
Recipe used: Simply Recipes, Old Fashioned Pumpkin Pie
Pecan pie
A contender to the pumpkin pie, the price of making a pecan pie from scratch has not seen quite as dramatic a price increase as that of a pumpkin pie. The typical recipe is made from pie crust (homemade using all-purpose flour and butter), eggs, syrup, brown sugar, butter, and of course, pecans. However, honey is a viable alternative to syrup and was used in this historical price analysis.
The price for these ingredients has risen by 1748.3% since 1960. Today, the cost of making a pecan pie is $13.86. Back in 1960, the same ingredients cost as little as $0.75.
| Year | Cost of pecan pie |
|---|---|
| 1960 | $0.75 |
| 1961 | $0.75 |
| 1962 | $0.75 |
| 1963 | $0.75 |
| 1964 | $0.75 |
| 1965 | $0.76 |
| 1966 | $0.80 |
| 1967 | $0.79 |
| 1968 | $0.81 |
| 1969 | $0.86 |
| 1970 | $0.90 |
| 1971 | $0.91 |
| 1972 | $0.93 |
| 1973 | $1.04 |
| 1974 | $1.09 |
| 1975 | $1.18 |
| 1976 | $1.28 |
| 1977 | $1.31 |
| 1978 | $1.40 |
| 1979 | $1.56 |
| 1980 | $2.56 |
| 1981 | $2.83 |
| 1982 | $3.00 |
| 1983 | $3.11 |
| 1984 | $3.23 |
| 1985 | $3.25 |
| 1986 | $3.36 |
| 1987 | $3.39 |
| 1988 | $3.45 |
| 1989 | $3.59 |
| 1990 | $3.61 |
| 1991 | $3.70 |
| 1992 | $3.69 |
| 1993 | $3.68 |
| 1994 | $3.70 |
| 1995 | $3.81 |
| 1996 | $4.20 |
| 1997 | $4.34 |
| 1998 | $4.79 |
| 1999 | $4.69 |
| 2000 | $4.66 |
| 2001 | $5.20 |
| 2002 | $5.20 |
| 2003 | $5.18 |
| 2004 | $5.65 |
| 2005 | $5.59 |
| 2006 | $5.53 |
| 2007 | $5.83 |
| 2008 | $6.19 |
| 2009 | $6.05 |
| 2010 | $6.23 |
| 2011 | $6.64 |
| 2012 | $6.65 |
| 2013 | $6.70 |
| 2014 | $6.80 |
| 2015 | $7.06 |
| 2016 | $6.86 |
| 2017 | $6.88 |
| 2018 | $7.25 |
| 2019 | $7.15 |
| 2020 | $7.06 |
| 2021 | $7.11 |
| 2022 | $6.71 |
| 2023 | $8.31 |
| 2025 | $13.86 |
Recipe used: Simply Recipes, Easy Pecan Pie
Methodology
To ensure consistency with previous versions of this study, this analysis used a 2019 YouGov survey of 1,227 US adults to establish the most popular Thanksgiving dinner dishes: turkey, mashed potatoes, cranberry sauce, stuffing, sweet potato casserole, green bean casserole, bread rolls, mac & cheese, corn, salad, pumpkin pie, and pecan pie. Previous editions of this study have used the same dataset for consistency, allowing for direct comparisons over time. A more recent version of the YouGov survey, conducted in 2024 among 1,595 U.S. adults, supports many of the same conclusions with some slight changes in most popular Thanksgiving dinner dishes listed.
The exact measurement of each ingredient required to cook and/or prepare these dishes was factored to calculate how much each dish would cost over time. Exact recipes used can be found next to each dish. Recipe and portion sizes were calculated based on 10 people.
Historical household income was recorded using Census.gov (1960-2024).
Replacement goods
In some instances, the traditional recipe may have changed since 1960, such as accounting for the wide availability of dried pasta today, which wasn’t as available historically. In those instances, the research calculated the cost of substitutes that could be used instead. This includes:
- Homemade pie crust (substitute for unbaked pie crust) - https://www.bettycrocker.com/how-to/tipslibrary/baking-tips/how-to-make-pie-crust
- Salted butter and water (substitute for chicken broth) - https://www.ashcroftfamilytable.com/substitute-for-chicken-broth/
- Homemade pasta (substitute for pasta) - https://www.jamieoliver.com/recipes/pasta-recipes/a-basic-recipe-for-fresh-egg-pasta/
- Sweet potato (substitute for pumpkin puree) - https://www.tasteofhome.com/article/canned-pumpkin-puree-substitutions
- Homemade cream cheese (substitute for cream cheese) - https://www.biggerbolderbaking.com/how-to-make-cream-cheese/
- Baking powder (substitute for yeast) - https://www.healthline.com/nutrition/yeast-substitute
Cost of goods
The following data sources and methodologies were used to calculate the cost of Thanksgiving goods over time. There were often data gaps in the year 1979 specifically, this gap was filled using a trend analysis to predict the price based on cost data from 1978 and 1980.
Turkey
- 2025: Selina Wamucii, US Turkey Meat Prices
- 2023-2019: American Farm Bureau Federation news releases and Thanksgiving dinner survey
- https://www.fb.org/market-intel/as-turkey-production-rises-prices-drop-just-in-time-for-thanksgiving
- https://www.fb.org/imgz/Initiatives/MarketBasket/Year_Over_Year_Price_Comparison_22.pdf
- https://www.fb.org/files/2020-Year-to-Year-Prices-AFBF-Thanksgiving-Dinner-Cost_Survey.pdf
- 2018 - 2010: Agriculture.com
- 2009-1960: AFBF costs adjusted using the Bureau of Labor Statistics consumer price index for food at home in November each year, via 24/7 Wall St.
Eggs
- 2025: Walmart’s Vital Farms Pasture Raised Grade A Brown Eggs, Large, 12 Ct
- 2023-1980: U.S. Bureau of Labor Statistics, Eggs, grade A, large, per doz. in U.S. city average, average price, not seasonally adjusted.
- 1979-1960: Stacker, The cost of goods the year you were born.
- Six eggs used for pecan and pumpkin pies.
Milk
- 2025-1995: U.S. Bureau of Labor Statistics, ‘Milk, fresh, whole, fortified, per gal. (3.8 lit) in U.S. city average, average price, not seasonally adjusted’
- 1994-1960: Stacker, The cost of goods the year you were born.
- 2 cups of milk used for sweet potato casserole, bread rolls, mac & cheese.
Potato
- 2025-1986: FRED, Average Price: Potatoes, White (Cost per Pound/453.6 Grams) in U.S. City Average
- 1985-1960: Stacker, The cost of goods the year you were born.
- 5lb potatoes used for mashed potatoes.
Butter
- 2025-2018: FRED, Average Price: Butter, Stick (Cost per Pound/453.6 Grams) in U.S. City Average
- 2017-2013: Cost adjusted using BLS CPI Inflation Calculator
- 2012-1979: U.S. Bureau of Labor Statistics via https://www.in2013dollars.com/Butter/price-inflation
- 1978-1960: Cost adjusted using BLS CPI Inflation Calculator
- 8oz butter used for mashed potatoes, ¼ cup for bread rolls, 4tbsp for pecan pie, 8tbsp for sweet potato casserole, ¾ cup for mac and cheese, 1 cup for stuffing.
Corn
- 2025: Walmart’s Birds Eye Steamfresh Super Sweet Corn, Frozen Vegetables, 10 oz. Bag
- 2023-1997: Walmart’s Great Value Frozen Whole Kernel Corn, 32 oz Bag, price per lb calculated. Cost adjusted over time using BLS CPI Inflation Calculator.
- 1996-1960: USDA Economic Research Service, Consumer Price Indexes for food and percentage changes from previous years for 1996 and 1995, then cost adjusted over time.
Yeast
- 2025: Walmart’s Pack of 20, Red Star Platinum Instant Sourdough Yeast, 0.63 oz
- 2023-1960: ½ Tablespoon used with cost of Red Star’s Platinum Yeast, cost adjusted over time using BLS CPI Inflation Calculator. 2 ¼ teaspoons used for bread rolls.
Flour
- 2025: FRED, Average Price: Flour, White, All Purpose (Cost per Pound/453.6 Grams) in U.S. City Average
- All years: USDA Economic Research Service, Price Spreads from Farm to Consumer, Flour, white, all-purpose, per pound. (Data taken for 2022-2000 and inflation-adjusted for 2023 and prior to 1999).
- https://www.ers.usda.gov/data-products/price-spreads-from-farm-to-consumer/price-spreads-from-farm-to-consumer/#Fresh%20fruit File is a downloadable spreadsheet.
Cheddar cheese
- 2025-1984 : FRED, Average Price: Average Price: Cheddar Cheese, Natural (Cost per Pound/453.6 Grams) in U.S. City Average
- 1983 and 1979: Cost adjusted using BLS CPI Inflation Calculator
- 1982-1980: USITC Publication, Issue 841 Annual report - United States International Trade Commission, United States International Trade Commission
- 1979-1960: United States Department of Agriculture Economics and Statistics Service Agricultural Economic Report No. 462, Cheese Pricing, Harold W. Lough
- https://ageconsearch.umn.edu/record/305674/files/aer294.pdf File is a downloadable spreadsheet.
- 9 cups for mac and cheese, 1 cup for green bean casserole
Sugar
- 2025: FRED, Average Price: Sugar, White, All Sizes (Cost per Pound/453.6 Grams) in U.S. City Average
- All years: USDA Economic Research Service, Price Spreads from Farm to Consumer, Sugar, white, per pound. (Data taken for 2019-2000 and inflation-adjusted for 2023 and prior to 1999).
- https://www.ers.usda.gov/data-products/price-spreads-from-farm-to-consumer/price-spreads-from-farm-to-consumer/#Fresh%20fruit File is a downloadable spreadsheet.
- ⅔ cup used for pumpkin pie, ½ cup for pecan pie, ½ cup for sweet potato casserole, 1 cup for cranberry sauce.
Orange juice
- 2025: FRED, Average Price: Orange Juice, Frozen Concentrate, 12 Ounce Can (Cost per 16 Ounces/473.2 Milliliters) in U.S. City Average
- 2022-1995: Statistia, Retail price of navel oranges in the United States from 1995 to 2022
- 1994-1960: Cost adjusted using BLS CPI Inflation Calculator.
- 1 cup used in cranberry sauce.
Cranberry
- 2025: Selina Wamucii, US Cranberries Prices
- 2023-1960: Walmart’s Fresh Cranberries category average calculated. Cost adjusted over time using BLS CPI Inflation Calculator. 1lb used.
Sweet potato
- 2025: Walmart’s Sweet Potatoes Whole Fresh, 3 lb Bag
- 2023-1960: USDA, National Retail Report - Specialty Crops, Advertised Prices for Specialty Crops Products at Major Retail Supermarket Outlets ending during the period of 10/21/2023 to 11/2/2023. Cost taken for 3lb sweet potato bag retail price average for October 2023 and 2022. Inflation adjusted for previous years.
- 4 cups large sweet potatoes used for sweet potato casserole.
Pumpkin puree
- 2025: Walmart’s Great Value 100% Pure Pumpkin, 15 oz
- 2023-1960: Walmart’s Pumpkin puree category average calculated. Cost adjusted over time using BLS CPI Inflation Calculator. 15oz calculated.
Green beans
- 2025: Walmart’s Great Value Cut Green Beans, Canned Green Beans, 14.5 oz Can
- 2023-2017: Walmart’s Fresh Green Beans cost used. Cost adjusted over time using BLS CPI Inflation Calculator. 29oz calculated.
- 2016-1960: USDA, Green beans—Average retail price per pound and per cup equivalent, 2016
Onions
- 2025: Walmart’s Fresh Whole Yellow Onion, Each
- 2023-1960: USDA, National Retail Report - Specialty Crops, Advertised Prices for Specialty Crops Products at Major Retail Supermarket Outlets ending during the period of 10/21/2023 to 11/2/2023. Cost taken for 2lb onion bag retail price average for October 2023 and 2022. Inflation adjusted for previous years.
Pecans
- 2025: Walmart’s Great Value Pecan Halves, 8 oz
- 2023-1960: Walmart’s Pecans category average cost used. Cost adjusted over time using BLS CPI Inflation Calculator. 2 cups calculated.
Sage
- 2025: Walmart’s Fresh Sage, 0.5 oz Clamshell
- 2023-1960: Walmart’s Fresh sage category average cost used. Cost adjusted over time using BLS CPI Inflation Calculator. ¼ cup used.
Green leaf lettuce
- 2023-1960: USDA, National Retail Report - Specialty Crops, Advertised Prices for Specialty Crops Products at Major Retail Supermarket Outlets ending during the period of 10/21/2023 to 11/2/2023. Cost taken for 1lb green leaf lettuce retail price average for October 2023 and 2022. Inflation adjusted for previous years.
Parsley
- 2025: Walmart’s Fresh Parsley, 0.5 oz Clamshell
- 2023-1960: Walmart, Fresh Italian Parsley Bunch, Each. Cost adjusted over time using BLS CPI Inflation Calculator. 2/3 cup calculated.
Celery
- 2025: Walmart’s Fresh Celery Sticks, 20 oz Bag
- 2023-1960: USDA, National Retail Report - Specialty Crops, Advertised Prices for Specialty Crops Products at Major Retail Supermarket Outlets ending during the period of 10/21/2023 to 11/2/2023. Cost taken for 1lb celery retail price average for October 2023 and 2022. Inflation adjusted for previous years.
Bread
- 2025: Walmart’s Freshness Guaranteed French Bakery Bread Loaf, 14 oz, 1 Count
- 2023-1980: FRED, Average Price: Bread, White, Pan (Cost per Pound/453.6 Grams) in U.S. City Average. 1lb used in stuffing.
- 1979-1960: Stacker, The cost of goods the year you were born.
- 1lb calculated.
Vanilla
- 2025: Walmart’s Great Value Pure Vanilla Extract, 1 fl oz
- 2023-1960: Walmart, the average cost of McCormick All Natural Pure Vanilla Extract, 1 fl oz Baking Extracts and Great Value Pure Vanilla Extract, 1 fl oz (Ambient). Cost adjusted over time using BLS CPI Inflation Calculator. 1tsp calculated.
Sources
- [1] YouGov, ‘What Americans plan to eat for Thanksgiving’ https://today.yougov.com/society/articles/50983-poll-what-americans-plan-to-eat-thanksgiving
- [2] Mc Graw Hill, ‘Corn Prices Have Popped’ https://www.mheducation.com/highered/blog/2024/04/corn-prices-have-popped
- [3] epicurious, ‘How Bagged Salad Mix Took Over the Produce Section’ https://www.epicurious.com/ingredients/bagged-salad-history