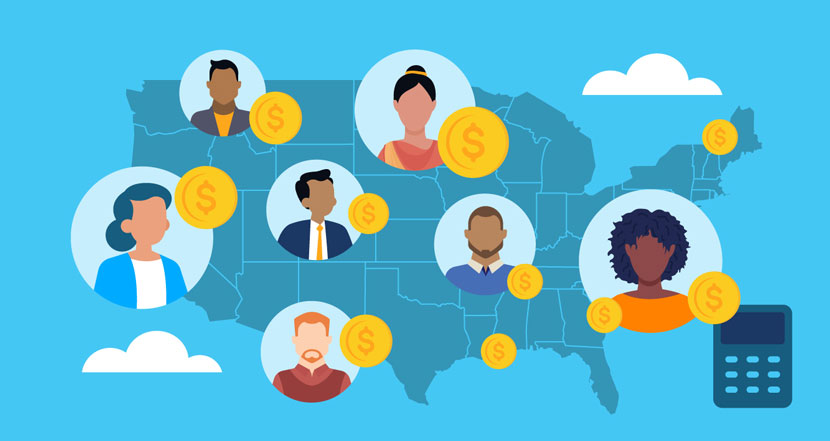
Gen Z Financial Habits: Spending and Saving Stats
The cost of living can impact different generations in a variety of ways, but how do today’s young people manage their spending and saving? A survey of 2,038 adults was conducted on behalf of Self to understand Gen Z financial habits, including what this group is spending money on, how much they’re saving, and what their biggest money worries are.
Who are Gen Z?
Generation Z is the name given to people born between 1997 and 2012. According to 2024 data from Statista, Gen Z makes up 20.8% of the U.S. population with over 70 million people in this age group. [1] U.S. Census, “U.S. Population Grows at Fastest Pace in More Than Two Decades” https://www.census.gov/library/stories/2024/12/population-estimates.html
This makes them the second-largest generation group in the U.S., following millennials (21.8%) and just slightly ahead of Baby Boomers (19.7%). [2] Statista, “U.S. Population Share by Generation” https://www.statista.com/statistics/296974/us-population-share-by-generation/
Key Statistics
- The estimated average amount that people in the Gen Z age group have in savings is $1,804.
- Gen Z is the second-largest generational group in the U.S., making up 20.8% of the population, behind millennials (21.8%).
- The estimated average annual earnings for Gen Z are $25,204, or $2,100 per month.
- Gen Z spends most of their money on household bills and expenses, with 51% saying they spent the most money on these costs.
- Gen Zers have an average student loan balance of $22,948, while Gen Xers have the highest average student loan balance at $44,240.
- 7.3% of Gen Z don’t think they’ll ever have enough money to buy their own home.
- The estimated average amount Gen Z spends on socializing is $175 per month, totaling $2,100 a year.
- Over half (57%) of people in the Gen Z age group said they often buy items after seeing them on social media.
- 41.7% of Gen Z said they mostly shop online when buying clothes, accessories, and gadgets.
How much does Generation Z earn?
With Gen Z being quite a wide-ranging age group, earnings can vary from teenagers who get a weekly or monthly allowance, to those in their mid-20s with a degree and a full-time job. The study findings show that Gen Z respondents earned an estimated average of $2,100 per month, with an annual average of $25,204, though the highest percentage of respondents (48.3%) say they earn $501-$1,000 per month).
The most common monthly earnings among Gen Z respondents were between $501-$1,000 per month, with 48.3% saying they earned this much. The next largest proportion (18.5%) said they earn between $2,501 and $5,000 per month.
Side hustles
The survey also asked respondents whether they have a side hustle, defined as an extra source of income outside of their main occupation. Over four in five (91.4%) of Gen Z said that they do have some form of side hustle.
This links back to data from a side hustle study, which found that those aged 18-28 were making an average of $269 per month from their side jobs, or $3,228 a year.
Living situation
When asked about their current living situation, the most common answer was living at home with parents or family, with 50.3% of the group. However, 31.9% said they rented a property, either on their own, with roommates or with a partner. Only 17.9% of Gen Z said they owned their own home.
| Current home situation |
% of Gen Z |
| Current home situation |
% of Gen Z |
| Live at home with parents or family |
50.3% |
| I own my property |
17.9% |
| I rent a property on my own |
16.6% |
| I rent a property with a partner |
11.3% |
| I rent a property with roommates |
4.0% |
What do Gen Z spend money on?
A report by NIQ suggests that Gen Z’s wealth could grow to $12 trillion globally by 2030. [3] Nielsen IQ, “A Report on Gen Z Spending” https://nielseniq.com/global/en/landing-page/spend-z/ But what do people in this age group spend their money on?
With Gen Z’s ages ranging from teens to late 20s, there’s a mixture of things they are most likely to spend their money on. Some will get most of their money in the form of an allowance, some might have part-time jobs, and others may work full-time and live in their own home. Let’s take a look at the breakdown of spending.
In the survey, respondents were able to select more than one answer for the things they spend the most money on. From the people surveyed, the most common thing they spent their money on was household bills and expenses (51%), and this was closely followed by clothes and accessories (49%).
| What Gen Z spend the most money on |
% of Gen Z |
| Household bills and expenses |
51% |
| Clothes and accessories |
49% |
| Food delivery/eating out |
43% |
| Going out/entertainment |
30.5% |
| Toys and games |
29.8% |
| Travel |
28.5% |
| Online services |
21.9% |
| Personal care |
10.6% |
| Healthcare products/medication |
10.6% |
| Technology |
8.6% |
| Sports or gym |
6% |
| Paying off debt |
2% |
| Student loans |
2% |
| Other |
0.7% |
Data note: Respondents could select up to three of their largest monthly expenses
Household bills and expenses
When asked how much they typically spend per month on household expenses including things like rent and bills, the average amount Gen Z said they spent was $784, which is $9,408 per year. Around half (55.6%) said they spent between $101 and $600 on these costs. The most common answer was $101-$300 with 29.8% of the group.
On the highest end of the scale, only 0.7% of respondents spent over $2,000 per month on household bills and expenses, while 2% said they spent nothing at all on these types of costs.
| How much Gen Z spends on household bills and expenses |
% of Gen Z |
| $0 |
2% |
| $1 - $50 |
6% |
| $51 - $100 |
15.2% |
| $101 - $300 |
29.8% |
| $301 - $600 |
25.8% |
| $601 - $1,000 |
13.2% |
| $1,001 - $1,500 |
6.6% |
| $1,501 - $2,000 |
0.7% |
| $2,000+ |
0.7% |
Spending on entertainment
The estimated average amount Gen Z spent on entertainment was $157 per month, amounting to $1,884 per year, which includes streaming services, music, gaming and similar products. However, one-fifth (21.2%) of the group said they spent between $51 and $80 on entertainment. Over half (54.3%) of Gen Z said they spend between $1 and $110 on entertainment. A small percentage (4%) said they spend over $700 per month on entertainment.
| How much Gen Z spends on entertainment |
% of Gen Z |
| $0 |
3.3% |
| $1 - $20 |
7.3% |
| $21 - $50 |
8.6% |
| $51 - $80 |
21.2% |
| $81 - $110 |
17.2% |
| $111 - $150 |
11.3% |
| $151 - $200 |
11.9% |
| $201 - $300 |
8.6% |
| $301 - $500 |
4.0% |
| $501 - $700 |
2.6% |
| $701 - $1,000 |
4.0% |
Spending on social events
When it came to spending on socializing, like eating out or going to a bar or club, the estimated average amount Gen Z spent was $175 per month, or just over $2,100 per year.
To break it down, 17.9% of Gen Z respondents said they spent between $81 and $110 per month on social activities. But across the entire group, almost two-thirds (60.3%) spent between $1 and $150 on socializing each month.
| How much Gen Z spends on socializing |
% of Gen Z |
| How much Gen Z spends on socializing |
% of Gen Z |
| $0 |
5.3% |
| $1 - $20 |
5.3% |
| $21 - $50 |
9.9% |
| $51 - $80 |
15.2% |
| $81 - $110 |
17.9% |
| $111 - $150 |
11.9% |
| $151 - $200 |
8.6% |
| $201 - $300 |
10.6% |
| $301 - $500 |
9.3% |
| $501 - $700 |
3.3% |
| $701 - $1,000 |
0.7% |
| $1,000+ |
2% |
Shopping for clothes, cosmetics and gadgets
Survey respondents were asked how much money they typically spend on shopping for clothes, cosmetics, gadgets and similar items each month. The estimated average amount Gen Z spent on these items was $193 per month, a yearly sum of $2,316. The largest proportion of the group (15.9%) said they spent between $51 and $80 a month on shopping for these items.
Almost half (49.8%) said that their spending on clothes, cosmetics and gadgets was between $1 and $110 per month. 1.3% of the group even said they spent over $1000 per month on shopping for these items.
| How much Gen Z spends on shopping |
% of Gen Z |
| $0 |
4% |
| $1 - $20 |
6% |
| $21 - $50 |
9.3% |
| $51 - $80 |
12.6% |
| $81 - $110 |
21.9% |
| $111 - $150 |
8.6% |
| $151 - $200 |
11.3% |
| $201 - $300 |
7.3% |
| $301 - $500 |
10.6% |
| $501 - $700 |
4% |
| $701 - $1,000 |
3.3% |
| $1,000+ |
1.3% |
Where does Gen Z usually shop?
The largest proportion of Gen Zers say they do most of their shopping online, with 41.7% saying they mostly shop online for their clothes, accessories, and gadgets. This was closely followed by 39.7% who say they mainly shop at the mall. The use of online shopping has decreased among Gen Z since our 2022 survey, when 51.5% preferred to shop online, and 22.8% most commonly chose the mall. Data from a CNBC report on Gen Z shopping habits shows that some Gen Zers prefer going to their local mall because they can try on clothes without having to deal with the online returns process. [4] CNBC, “Gen Z to the Rescue? How Malls Are Winning Over a Generation” https://www.cnbc.com/2024/12/12/gen-z-shopping-at-malls-rather-than-online.html
Across all other age groups, the mall is the most popular way to shop, with 50.1% of respondents selecting this option.
| How Gen Z usually shop for clothes, accessories, and gadgets |
% of Gen Z |
| Online |
41.7% |
| At the mall |
39.7% |
| At individual stores |
16.6% |
| Thrift stores |
2% |
Social media and buying habits
When looking at Gen Z’s personal finance habits, survey respondents were asked whether they ever bought products after seeing them on social media. Over half (57%) said that they sometimes buy items they have seen on social media, 42.4% said they do this often, and only 0.7% said they have never bought an item after seeing it on social media.
| How often Gen Zers buy products after seeing them on social media |
% of Gen Z |
| Often |
42.4% |
| Sometimes |
57% |
| Never |
0.7% |
A 2024 survey by Grin found that, in the U.S., Gen Zers are more likely to use social media to find new products than search engines. 42% of Gen Z say they use TikTok to discover new products, and 26% use Instagram, while only 20% say they use Google for this purpose. [5] Grin, “Influencer Marketing and Customer Buying Journey” https://grin.co/blog/influencer-marketing-and-the-customer-buying-journey/
The use of social media over Google was higher in Gen Z than in all other generations, with Gen X and Baby Boomers using Google the most for product discovery (61%).
How much does Gen Z have in savings?
The results of the survey showed that the estimated average amount Gen Z has in savings is $1,804.
Just over a third (33.8%) of Gen Z respondents said they had between $501-$1,000 in savings. At either end of the savings scale, 4.6% of Gen Z said they had no savings at all, and 3.3% said they had over $10,000 saved.
| How much Gen Z has in savings |
% of Gen Z |
| $0 |
4.6% |
| $1-100 |
6.6% |
| $101-$500 |
28.5% |
| $501-$1,000 |
33.8% |
| $1,001-$5,000 |
17.2% |
| $5,001-$10,000 |
6.0% |
| Over $10,000 |
3.3% |
Emergency funds
As well as asking about their total savings amount, respondents were also asked whether they set money aside to cover the costs of emergency events. An overwhelming majority (85.3%) said they did save money specifically to use in an emergency.
A study by Bankrate found that 26% of people who had dipped into their emergency savings in the past year had spent between $1,000 and $2,499 covering unexpected costs, so this suggests Gen Z in this study could be actively preparing for unexpected costs. [6] Bankrate, “Emergency Savings Report” https://www.bankrate.com/banking/savings/emergency-savings-report/
Gen Z financial security
When it comes to financial security, this can mean different things depending on your circumstances. In general terms, having financial security or stability can mean you are able to pay your essential bills, you have access to safe housing, healthy foods and other necessities, and you’re able to plan for the future.
The survey asked respondents whether they felt financially stable. The majority (83.4%) of those in the Gen Z age group said they did feel that they had personal financial stability, while 14.6% said they don’t feel financially stable. Across respondents from all age groups, 47.9% said they do not feel financially stable, indicating that Gen Zers feel more financially stable than those in other generations.
Gen Z debt statistics
With student loan debt on the rise and the cost of living increasing, this study looked into how many Gen Zers are in debt, and how much debt they’re in. It also found out how common it is for them to take out a loan, and what kind of things they take loans out for.
Student Loans
Student loan debt grew in 2024, with the total amount of student debt in the U.S. sitting at $1.777 trillion. [7] Education Data, “Student Loan Debt Statistics” https://educationdata.org/student-loan-debt-statistics Generation X has the most student loan debt, with an average balance of $44,240, while Gen Zers have an average student loan balance of $22,948. However, it’s important to remember that many Gen Zers have not yet reached college age, or may be partway through their college education.
Three-quarters (74.8%) of Gen Z survey participants said they had at least some student loan debt.
Taking out loans
Many people may take out loans to cover unexpected costs, or for things like college tuition and car payments. The majority (88.1%) of those asked said that they had taken out a loan of some sort.
Participants who had taken out a loan were asked what they used it for, with the option to select all that applied to them. Not including student loans, the most common thing Gen Z had taken a loan out for was regular household expenses, with 50.3% saying they used a loan to cover these costs. This was followed by medical costs at 48.3% and car repairs at 41.7%.
A 2024 study by Gallup found that 18% of 18-29-year-olds had needed to borrow money to pay for healthcare in the last 12 months, the highest proportion of any age group to do so. [8] Gallup, “Americans Borrow Estimated $74 Billion for Medical Bills” https://news.gallup.com/poll/657041/americans-borrow-estimated-billion-medical-bills-2024.aspx
| What Gen Zers have taken out loans for |
% of Gen Z |
| What Gen Zers have taken out loans for |
% of Gen Z |
| Regular household expenses |
50.3% |
| Medical costs |
48.3% |
| Student loan |
42.4% |
| Car repairs |
41.7% |
| Home repairs |
29.1% |
| Pet emergency |
20.5% |
| Emergency travel |
11.9% |
Are Gen Z worried about money?
Money concerns affect individuals across all generations, but how do Gen Zers feel about their finances, and which money worries cause them the most anxiety?
Survey respondents were asked how often they worried about money-related issues. More than one in five (22.5%) said they worried about money every day, with over half (56.3%) saying they worried about money at least once a week, and 15.2% said they only worry about money a few times a year.
| How often Gen Zers worry about money |
% of Gen Z |
| Once a week |
33.8% |
| Once a month |
28.5% |
| Every day |
22.5% |
| A few times a year |
15.2% |
Financial concerns they worry about the most
The most common thing that Gen Zers said they worry about when it comes to their finances is healthcare and medical bills, with 51.7% saying this is what worries them the most. This was followed by household bills, which half of Gen Z respondents (50.3%) said they worried about the most in relation to money.
Just over a third (34.4%) worried the most about paying off debt, and only 1.3% said they don’t worry about money at all.
Alongside this, 7.3% of Gen Z said they don’t think they’ll ever have enough money to buy their own home.
| Financial concerns Gen Zers worry about the most |
% of Gen Z |
| Healthcare and medical bills |
51.7% |
| Household bills |
50.3% |
| Saving money |
40.4% |
| Paying off debt |
34.4% |
| Paying for college |
25.2% |
| Paying for a car |
21.9% |
| I don't worry about money |
1.3% |
Data note: Respondents could select up to three of their largest monthly expenses
Gen Z and financial planning
As previously mentioned, almost all Gen Z participants (98.7%) said there were at least some financial concerns they worried about. They were also asked whether they did any kind of financial planning, 91.4% said yes, they do some form of financial planning. This was much higher than across respondents from all generations, where 53.7% said they do some kind of financial planning.
Gen Z and credit scores
Credit scores can have a big impact on the financial aspects of our lives, they affect whether we can buy a house, get a credit card, or be approved for a loan. Gen Z participants were asked how important they thought a credit score was on a scale of 1 - 5, with 1 being ‘not important at all’, and 5 being ‘very important’.
Over 90% scored the importance of a credit score as a 4 or a 5, with 41.1% saying it was very important. Only 0.7% of respondents thought a credit score was not very important.
| How important Gen Zers think a credit score is |
% of Gen Z |
| 1 - Not important at all |
0% |
| 2 - Not very important |
0.7% |
| 3 - Somewhat important |
8.6% |
| 4 - Quite important |
49.7% |
| 5 - Very important |
41.4% |
Average credit scores by generation
The most recent data from Experian shows that, as of Q3 2024, the average Generation Z credit score is 681, the lowest average credit score of any generation. Average credit scores increase as age increases, and people in the Silent Generation (aged 79 and over) have the highest average credit score of 760. This pattern may reflect longer credit histories among older generations, and many Gen Zers are only just starting to build credit. [9] Experian, “What is the Average Credit Score in the U.S?” https://www.experian.com/blogs/ask-experian/what-is-the-average-credit-score-in-the-u-s/
| How important Gen Zers think a credit score is |
% of Gen Z |
| 1 - Not important at all |
0% |
| 2 - Not very important |
0.7% |
| 3 - Somewhat important |
8.6% |
| 4 - Quite important |
49.7% |
| 5 - Very important |
41.4% |
Methodology
The study surveyed 2,038 adults in July 2025, asking them about their financial habits, including spending, saving, and financial worries.
The breakdown of respondents was as follows:
- Gen Z (born 1997-2012): 15%
- Millennial (born 1981-1996): 43.1%
- Gen X (born 1965-1980): 41.7%
- Baby Boomer (born 1946-1964): 0.2%
Sources