Health insurance costs by state
The cost of health insurance can be a financial burden on top of the rising cost of living, but how does where you live affect how much you pay? This analysis looks at average health insurance costs by state to see which states have the most and least expensive premiums, and how costs have changed over time.
Key statistics
- The average cost of health insurance for a single person in the U.S. is $456 per month or $5,472 per year.
- 92% of the U.S. population have health insurance according to the latest Census, but 8.3% of the population (27.2 million people) did not have health insurance at any time during 2021.
- The most common type of health insurance coverage in the U.S. is private plans (66%), specifically employment-based plans, which cover 54.3% of Americans (or 178.3 million people).
- The cost of employer-sponsored health insurance plans has increased by 260% since 1999, with annual plans costing $2,196 in 1999, compared to $7,911 in 2022.
- People aged between 19 and 25 are the most likely to be uninsured (14.9% of this group have no insurance), but uninsured rates decrease with age; only 1.2% of over-65s are uninsured.
- The percentage of children (aged 0-17) with no health insurance fell to 4.5% in the third quarter of 2022, from 6.4% at the end of 2020.
- Employers spend more on health insurance than any other employee benefit, with 8.5% of an employee’s compensation being used for health insurance premiums.
How many people have health insurance in the U.S?
According to the latest Census figures, over 300 million have health insurance, equating to 92% of the population. 27.2 million people (8.3% of the population) did not have health insurance at any point during 2021. [1] Health Insurance Coverage in the United States - Census https://www.census.gov/library/publications/2022/demo/p60-278.html
Private health insurance is more prevalent than public, with 66% of people using private insurance compared to 35.7% using public plans. Some people use more than one type of health insurance, so these figures may overlap slightly.
Children’s health insurance
The percentage of children (aged 0-17) without health insurance fell to 4.5% in the third quarter of 2022, from 6.4% in late 2020.
This increase is partly due to a rise in Medicaid and CHIP coverage, as well as federal policies such as the Families First Coronavirus Response Act (FFCRA), and an expanded Marketplace Special Enrollment Period (SEP). [2] Children’s Health Insurance Coverage - ASPE https://aspe.hhs.gov/sites/default/files/documents/77d7cc41648a371e0b5128f0dec2470e/aspe-childrens-health-coverage.pdf
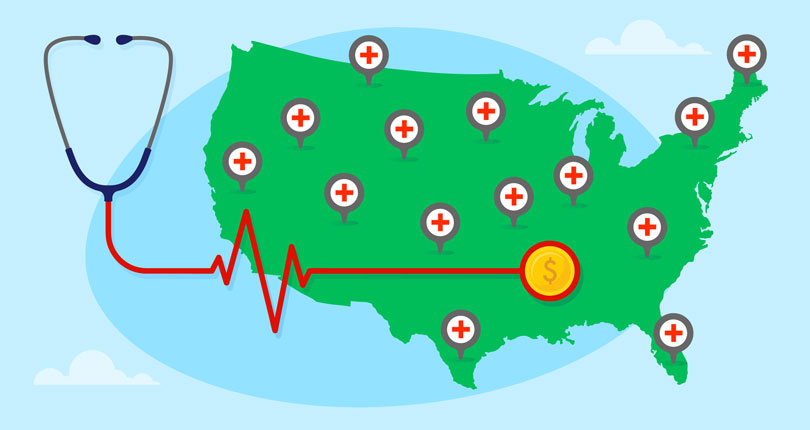
What is the average cost of health insurance by state?
The average cost of health insurance for a single person across the U.S. is $456 per month or $5,472 per year.
The most expensive state for health insurance is Vermont, where premiums cost an average of $841 per month, followed by West Virginia at $824 per month, and Wyoming at $802 per month.
Source [3] Marketplace Average Benchmark Premiums - Kaiser Family Foundation https://www.kff.org/health-reform/state-indicator/marketplace-average-benchmark-premiums/
The data used in this table shows average premiums for a silver benchmark plan for a 40-year-old in each state. This is the second-lowest-cost silver premium which is used as a benchmark when determining plan subsidies. Silver plans are generally referred to as the marketplace standard plan. [4] What is a Silver Plan? - Health Agents https://help.ihealthagents.com/hc/en-us/articles/224582387-What-is-a-Silver-Plan-
Why does health insurance vary by state?
If you purchase an individual health insurance policy from the marketplace, this will be managed and regulated at the state level. This means if you move to a different state, you’ll need to purchase a new plan which might vary in cost from your old plan. [5] How to Keep Your Health Insurance When You Move To Another State - Healthinsurance.org https://www.healthinsurance.org/obamacare/how-to-keep-your-health-insurance-when-you-move-to-another-state/
For people who use an employer-sponsored health insurance plan, if you’re not changing jobs, you may find that your coverage remains the same even if you move to a new state. If you do change jobs when you move and you switch from one employer plan to another, your coverage might change depending on the type of plan your new employer sets up for you.
Public health insurance plans like Medicare and Medicaid are also managed by each state, so eligibility requirements can vary depending on the state you live in.
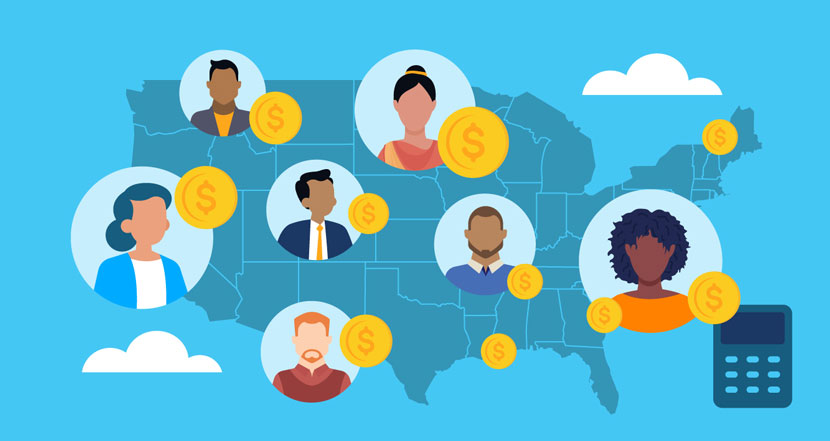
Employer-sponsored health insurance premiums
Around 159 million people in the U.S. are covered by employer-sponsored health insurance. The average annual premium for an employer plan is $7,911 for an individual and $22,463 for a family. On average, workers with this type of coverage pay 17% of the premium for a single person
|
Average employer-sponsored health insurance premium |
Employee contribution |
Percentage contributed by the employee |
|
Monthly |
Annually |
Monthly |
Annually |
|
| Single person |
Average employer-sponsored health insurance premium - monthly $659 |
Average employer-sponsored health insurance premium - annualy $7,911 |
Employee contribution - monthly $111 |
Employee contribution - annualy $1,327 |
Percentage contributed by the employee 17% |
| Family |
Average employer-sponsored health insurance premium - monthly $1,872 |
Average employer-sponsored health insurance premium - annualy $22,463 |
Employee contribution - monthly $509 |
Employee contribution - annualy $6,106 |
Percentage contributed by the employee 28% |
Source [6] 2022 Employer Health Benefits Survey - Kaiser Family Foundation https://www.kff.org/report-section/ehbs-2022-summary-of-findings/
Change in employer-sponsored health insurance premiums
The average premium for employer health insurance plans has increased a lot since 1999. Back then the average annual premium was $2,196, but in 2022 the average annual premium was $7,911. That marks a 260% increase over this 23-year period.
As premiums have increased, average worker contributions have also gone up, but the percentage of the premium that employees pay has remained fairly consistent. From 1999 to 2022 this percentage has fluctuated between 14.48% (in 1999) and 18.13% (in 2017). In 2022, the average percentage of the premium that workers contribute is 16.77%.
| Year |
Average employer health insurance premium |
Average worker contribution |
Worker contribution as a percentage of the total premium |
| 1999 |
$2,196 |
$318 |
14.48% |
| 2000 |
$2,471 |
$334 |
13.52% |
| 2001 |
$2,689 |
$355 |
13.20% |
| 2002 |
$3,083 |
$466 |
15.12% |
| 2003 |
$3,383 |
$508 |
15.02% |
| 2004 |
$3,695 |
$558 |
15.10% |
| 2005 |
$4,024 |
$610 |
15.16% |
| 2006 |
$4,242 |
$627 |
14.78% |
| 2007 |
$4,479 |
$694 |
15.49% |
| 2008 |
$4,704 |
$721 |
15.33% |
| 2009 |
$4,824 |
$779 |
16.15% |
| 2010 |
$5,049 |
$899 |
17.81% |
| 2011 |
$5,429 |
$921 |
16.96% |
| 2012 |
$5,615 |
$951 |
16.94% |
| 2013 |
$5,884 |
$999 |
16.98% |
| 2014 |
$6,025 |
$1,081 |
17.94% |
| 2015 |
$6,251 |
$1,071 |
17.13% |
| 2016 |
$6,435 |
$1,129 |
17.54% |
| 2017 |
$6,690 |
$1,213 |
18.13% |
| 2018 |
$6,896 |
$1,186 |
17.20% |
| 2019 |
$7,188 |
$1,242 |
17.28% |
| 2020 |
$7,470 |
$1,243 |
16.64% |
| 2021 |
$7,739 |
$1,299 |
16.79% |
| 2022 |
$7,911 |
$1,327 |
16.77% |
Source [7] Premiums and Worker Contributions Among Workers Covered by Employer-Sponsored Coverage - Kaiser Family Foundation https://www.kff.org/interactive/premiums-and-worker-contributions-among-workers-covered-by-employer-sponsored-coverage/
Employer spending on health insurance
Data from the Bureau of Labor Statistics shows that, after salary and wages, employers spend the most on health insurance compared to any other employee benefit. On average, salaries make up 67.2% of an employee’s compensation, followed by health insurance at 8.5%
| Breakdown of employee compensation from employers |
| Wages and salary |
67% |
| Health insurance |
8.50% |
| Paid leave |
7.40% |
| Retirement and savings |
7.20% |
| Legally required benefits |
6.60% |
| Supplemental pay |
2.60% |
| Disability insurance |
0.40% |
| Life insurance |
0.10% |
Source [8] Employer Costs for Employee Compensation - BLS https://www.bls.gov/news.release/ecec.t01.htm
Health insurance premiums by type in the U.S.
Data from the U.S. Census shows that 91.7% of people in the U.S. have some sort of health insurance coverage. This is through either a private plan like employment-based coverage, or a public plan like Medicare or Medicaid. This is an increase of 0.4 percentage points from 2020 when 91.4% of people were covered.
There are 27.1 million people in the U.S. who are medically uninsured, making up 8.3% of the population.
The most common type of health insurance coverage in the U.S. is private plans (66%), specifically employment-based plans which cover 54.3% of Americans (or 178.3 million people). Public health insurance plans cover 35.7% of people with Medicaid (18.9%) and Medicare (18.4%) providing the majority of this coverage.
| Health insurance coverage by type in the U.S. |
| Private plan |
66.0% |
| Public plan |
35.7% |
| Uninsured |
8.3% |
Source [1] Health Insurance Coverage in the United States - Census https://www.census.gov/library/publications/2022/demo/p60-278.html
Disclaimer: These figures may not add up to 100% due to rounding and the fact that people can be covered by more than one type of health insurance.
| Health insurance coverage type |
2020 |
2021 |
|
| Number (thousands) |
Percent |
Number (thousands) |
Percent |
Change in percent (2020-2021) |
| Health insurance coverage type Total |
Number (thousands) - 2020 327,521 |
Percent - 2020 x |
Number (thousands) - 2021 328,074 |
Percent - 2021 x |
|
| Health insurance coverage type Any health plan |
Number (thousands) - 2020 299,230 |
Percent - 2020 91.4% |
Number (thousands) - 2021 300,887 |
Percent - 2021 91.7% |
Change in percent (2020-2021) 0.4 |
| Health insurance coverage type Any private plan |
Number (thousands) - 2020 217,896 |
Percent - 2020 66.5% |
Number (thousands) - 2021 216,366 |
Percent - 2021 66.0% |
Change in percent (2020-2021) -0.6 |
| Health insurance coverage type Employment-based |
Number (thousands) - 2020 178,737 |
Percent - 2020 54.6% |
Number (thousands) - 2021 178,285 |
Percent - 2021 54.3% |
Change in percent (2020-2021) -0.2 |
| Health insurance coverage type Direct-purchase |
Number (thousands) - 2020 33,869 |
Percent - 2020 10.3% |
Number (thousands) - 2021 33,555 |
Percent - 2021 10.2% |
Change in percent (2020-2021) -0.1 |
| Health insurance coverage type Marketplace coverage |
Number (thousands) - 2020 10,924 |
Percent - 2020 3.3% |
Number (thousands) - 2021 11,389 |
Percent - 2021 3.5% |
Change in percent (2020-2021) 0.1 |
| Health insurance coverage type TRICARE |
Number (thousands) - 2020 9,165 |
Percent - 2020 2.8% |
Number (thousands) - 2021 8,299 |
Percent - 2021 2.5% |
Change in percent (2020-2021) -0.3 |
| Health insurance coverage type Any public plan |
Number (thousands) - 2020 112,925 |
Percent - 2020 34.5% |
Number (thousands) - 2021 117,095 |
Percent - 2021 35.7% |
Change in percent (2020-2021) 1.2 |
| Health insurance coverage type Medicare |
Number (thousands) - 2020 58,541 |
Percent - 2020 17.9% |
Number (thousands) - 2021 60,226 |
Percent - 2021 18.4% |
Change in percent (2020-2021) 0.5 |
| Health insurance coverage type Medicaid |
Number (thousands) - 2020 58,778 |
Percent - 2020 17.9% |
Number (thousands) - 2021 61,940 |
Percent - 2021 18.9% |
Change in percent (2020-2021) 0.9 |
| Health insurance coverage type VA and CHAMPVA |
Number (thousands) - 2020 2,967 |
Percent - 2020 0.9% |
Number (thousands) - 2021 3,151 |
Percent - 2021 1.0% |
Change in percent (2020-2021) 0.1 |
| Health insurance coverage type Uninsured |
Number (thousands) - 2020 28,291 |
Percent - 2020 8.6% |
Number (thousands) - 2021 27,187 |
Percent - 2021 8.3% |
Change in percent (2020-2021) -0.4 |
Source [1] Health Insurance Coverage in the United States - Census https://www.census.gov/library/publications/2022/demo/p60-278.html
The uninsured population in the U.S.
As mentioned earlier, 27.2 million people in the U.S. do not have any form of health insurance. Let’s take a look at statistics on these people and their demographics in a little more detail.
Percentage of people without health insurance by age group
How likely someone is to be uninsured can depend on age. Data shows that the age group most likely to have no health insurance coverage is those aged 19-25, with 14.9% of those in this group being uninsured.
Aside from those under 19 (including children who are more likely to be covered by family plans), the percentage of people without insurance decreases with age. People aged 65 or over are the least likely to be without insurance, with only 1.2% of people in this group being uninsured.
| Age group |
Percentage of uninsured |
| Under 19 |
5.0% |
| 19-25 |
14.9% |
| 26-34 |
13.5% |
| 35-44 |
11.9% |
| 45-64 |
9.4% |
| 65 or over |
1.2% |
Source [1] Health Insurance Coverage in the United States - Census https://www.census.gov/library/publications/2022/demo/p60-278.html
The uninsured population by race
Race also impacts how likely someone is to be uninsured. In 2022 Hispanics are the most likely to be uninsured with 20.9% of people in this group having no health insurance at all. This is followed by Black people at 10.4%.
White people are the least likely to be uninsured at 6.4%, and Asian people have an uninsured rate of 6.5%.
| Percentage of uninsured people by race |
| Hispanic |
20.9% |
| Black |
10.4% |
| Asian |
6.5% |
| White |
6.4% |
Source [9] Percentage of Americans Without Health Insurance by Race and Ethnicity - Statista https://www.statista.com/statistics/200970/percentage-of-americans-without-health-insurance-by-race-ethnicity/
Factors that affect health insurance premiums
There are a lot of different factors that have an impact on how much someone pays for health insurance in the U.S. Some of these things include:
- Age - As we get older, we typically find ourselves with more health issues than we had when we were younger. This is why your age can have an impact on how much your pay for your health insurance premium. Older people can find themselves paying up to three times more than younger people for health insurance.
- Where you live - As mentioned earlier, your location can also affect the cost of your health insurance premiums. Market coverage is regulated and marketed at the state level, meaning insurance plan costs vary depending on where you live.
- The type of plan - There are a range of different plan types which come with varying costs. Employer-sponsored plans tend to be cheaper for employees than individual plans. Marketplace coverage comes in four tiers; Bronze, Silver, Gold, and Platinum. Bronze plans have the cheapest premiums but the highest out-of-pocket costs, and Platinum plans are the opposite with a higher premium and lower deductibles and out-of-pocket costs.
- Who is on your plan - An insurance plan for an individual will be cheaper than one that includes a spouse and/or children and other dependents. But it’s often more cost-effective to purchase one family plan that covers everyone rather than buying separate policies for each family member.
- Whether or not you smoke - People who smoke often pay more for health insurance due to the fact that tobacco use can have negative impacts on your health. In fact, your premiums could be up to 50% higher in some states if you smoke compared to premiums for someone who doesn’t smoke. [10] How Health Insurance Marketplace Plans Set Your Premiums - Healthcare.gov https://www.healthcare.gov/how-plans-set-your-premiums/
Sources