Mapping Poverty: The Poverty Rates in Each U.S. State Over Time
Back in 2019, the U.S. had seen five years of declined poverty rates and recorded the lowest average poverty rate ever at 10.5%. When the COVID-19 pandemic hit one year later, this number rose by 8.5% to 11.4%, followed by a slight increase to 11.6% in 2021. [1] U.S. Census Bureau, ‘Historical Poverty Tables: People and Families - 1959 to 2021’ https://www.census.gov/data/tables/time-series/demo/income-poverty/historical-poverty-people.html
Using U.S. Census Bureau data, this report analyzes the poverty rates in each state over time to find out which states have seen the highest and lowest poverty rates historically and what this looks like in recent years.
Key U.S. poverty statistics
- The pandemic caused the U.S. to suffer the sharpest rise in poverty rates since the Great Recession.
- Poverty rates saw little change between 2020 and 2021 (11.4% vs 11.6%).
- In 2021, the U.S. poverty rate increased to 11.6% with 37.93 million Americans living in poverty.
- The financial effects of COVID-19 pushed an additional 3.9 million Americans into poverty.
- Poverty rates have increased in 25 states from 2020 to 2021, and increased in 39 states from 2019 to 2020.
- Illinois has seen the largest increase in poverty rates (33.75%) from 2020 to 2021.
- Mississippi ranked the most financially deprived state in the U.S. with 21.3% living in poverty, followed by Louisiana (19.95%).
- 2021 saw the highest percentage of those aged over 65 in poverty (10.3%), the highest in over two decades.
- Women aged under 18 are the most likely to be living in poverty (15.8%).
What is poverty and how is it defined?
To clarify it’s worth defining what poverty is in the U.S. The poverty threshold depends on factors such as age and family size. In 2022, the official poverty threshold for one person under the age of 65 with no children was an average yearly income of $15,225, in 2021, the same threshold was $14,097.
In 2022, for a household consisting of two adults and two children, the threshold would be $29,678. [2] U.S. Census Bureau, ‘Poverty Thresholds’ https://www.census.gov/data/tables/time-series/demo/income-poverty/historical-poverty-thresholds.html
Circumstances cause the definition of poverty to differ between every home and every state. In 2021, 37.93 million people were below the poverty threshold in the U.S.
Poverty rates across the U.S.
The below map reveals how poverty rates have changed in each state over time from 1980 to 2021 (the latest data available at the time of publishing).
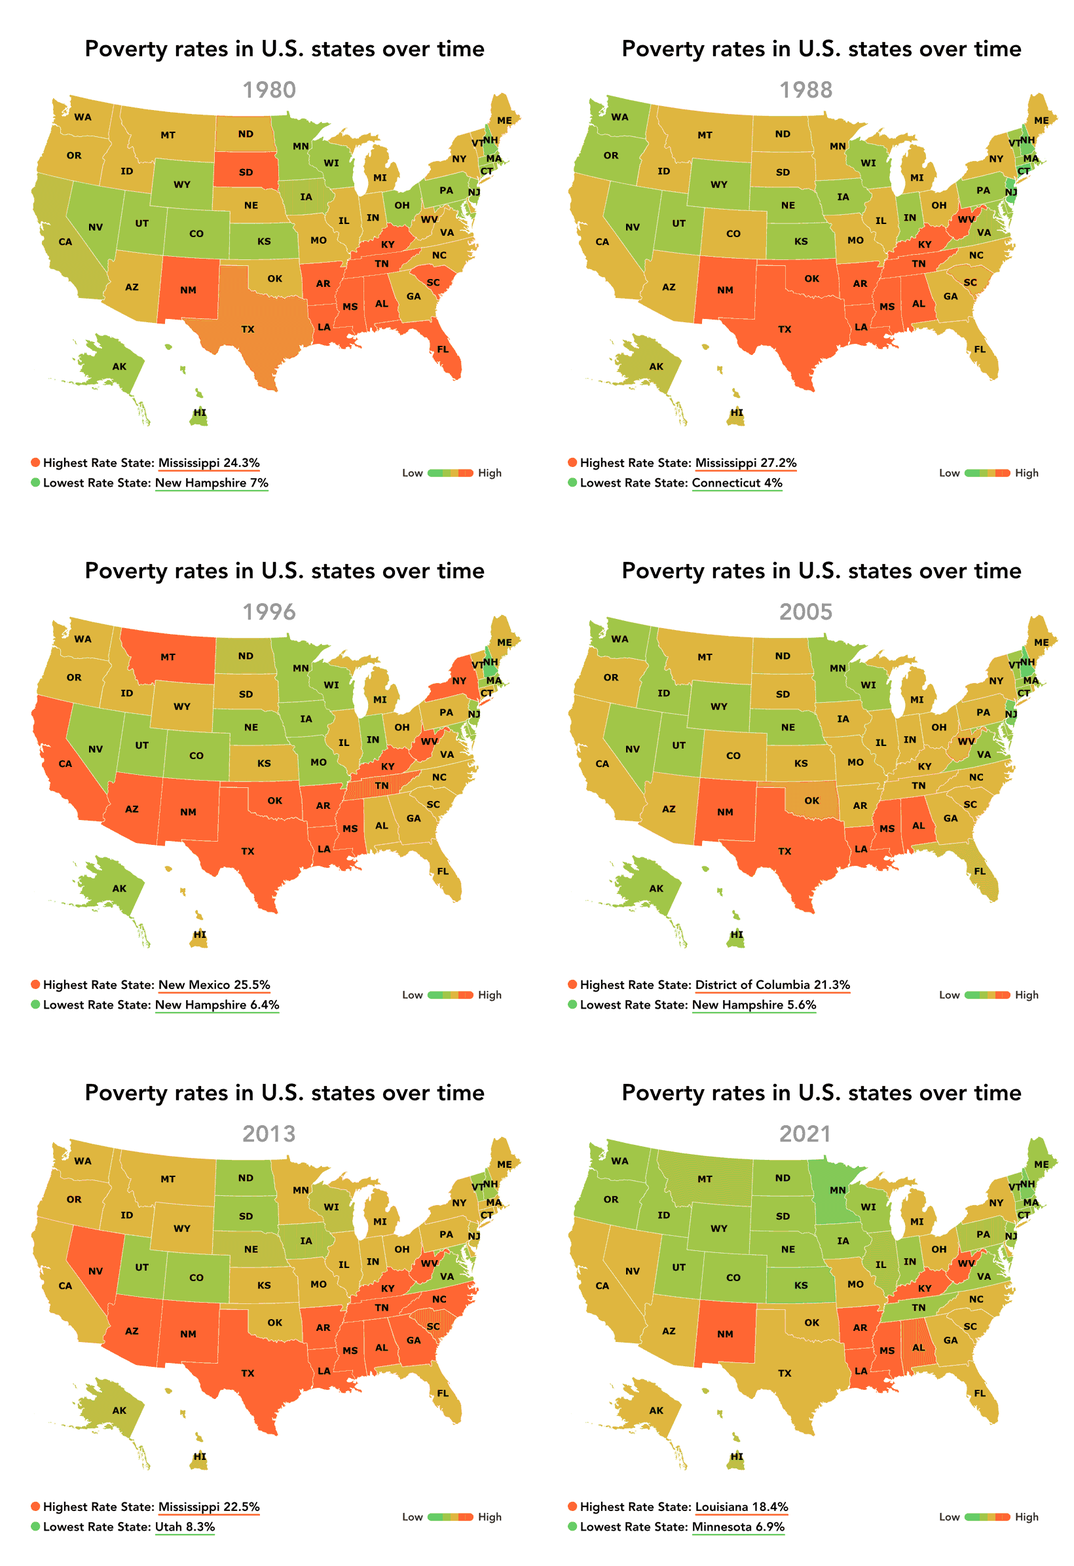
How poverty rates change in each U.S. region
The Southern states are the most poverty-stricken, and in 2020, the South saw an average poverty rate of 13.2%, a 0.1% decrease from 2020, but an increase of 1.2% compared to 2019.
Western states saw an average rate of 10.6% in 2020, rising to 11% in 2021. Midwestern states had an average poverty rate of 10.4%, while northeastern states had the lowest poverty rate at 10.1%.
| Regional poverty rates |
Northeast |
Midwest |
West |
South |
| 2019 |
9.40% |
9.70% |
9.50% |
12% |
| 2020 |
10.20% |
10.10% |
10.60% |
13.30% |
| 2021 |
10.10% |
10.40% |
11% |
13.20% |
Source [1] U.S. Census Bureau, ‘Historical Poverty Tables: People and Families - 1959 to 2021’ https://www.census.gov/data/tables/time-series/demo/income-poverty/historical-poverty-people.html
COVID-19 pandemic poverty rates
When the COVID-19 pandemic hit in 2020, the poverty rate increased in 39 of the 50 states, compared to 2019 levels. Reviewing the data for 2021, we can see that 38 states have now seen higher levels of poverty, with New York remaining the same from 2019 and 2021.
With a jump of nearly 86.5%, New Hampshire saw the largest growth in poverty out of all states. Despite this rise, the state's population still experiences the joint-lowest poverty rate (6.9%) in the country alongside Minnesota.
The state that saw the second largest growth in poverty was Delaware, where the poverty rate rose by 804% from 6.5% in 2019 to 10.5% in 2020 to 11.7% in 2021.
In New York, the poverty rate remained the same between 2019 and 2021, while 12 other states saw a decrease. Kansas saw the most substantial decline with a drop from 9.5% to 7.1% (-25.3%) allowed by South Dakota (-20.8%).
The full breakdown of how each state’s poverty levels have changed throughout the pandemic period can be seen in the table below. 2022 data will be updated when it is released by the U.S. Census Bureau and should be considered as part of a pandemic analysis.
|
Percentage of population living in poverty |
|
| State |
2019 |
2020 |
2021 |
2019-2021 Change |
| StateNew Hampshire |
20193.70% |
20206.20% |
20216.90% |
2019-2021 Change86.5% |
| StateDelaware |
20196.50% |
202010.50% |
202111.70% |
2019-2021 Change80.0% |
| StateOklahoma |
201910.80% |
202015.50% |
202115.10% |
2019-2021 Change39.8% |
| StateIdaho |
20197.10% |
20209.20% |
20219.30% |
2019-2021 Change31.0% |
| StateMissouri |
20199.40% |
202010.60% |
202112.30% |
2019-2021 Change30.9% |
| StateHawaii |
20198.40% |
202010.90% |
202110.90% |
2019-2021 Change29.8% |
| StateArizona |
20199.90% |
202010.80% |
202112.60% |
2019-2021 Change27.3% |
| StatePennsylvania |
20198.70% |
202010.60% |
202110.80% |
2019-2021 Change24.1% |
| StateAlabama |
201912.90% |
202014.90% |
202115.90% |
2019-2021 Change23.3% |
| StateNevada |
201910.40% |
202012.90% |
202112.80% |
2019-2021 Change23.1% |
| StateTexas |
201911.10% |
202014.00% |
202113.50% |
2019-2021 Change21.6% |
| StateWest Virginia |
201913.90% |
202014.10% |
202116.90% |
2019-2021 Change21.6% |
| StateMinnesota |
20195.70% |
20208.40% |
20216.90% |
2019-2021 Change21.1% |
| StateNew Jersey |
20196.30% |
20208.20% |
20217.60% |
2019-2021 Change20.6% |
| StateArkansas |
201914.10% |
202014.20% |
202116.80% |
2019-2021 Change19.1% |
| StateKentucky |
201913.60% |
202013.90% |
202116.20% |
2019-2021 Change19.1% |
| StateCalifornia |
201910.10% |
202011.00% |
202111.90% |
2019-2021 Change17.8% |
| StateNew Mexico |
201915.30% |
202016.50% |
202118.00% |
2019-2021 Change17.6% |
| StateGeorgia |
201912.10% |
202013.20% |
202114.00% |
2019-2021 Change15.7% |
| StateIllinois |
20199.30% |
20208.00% |
202110.70% |
2019-2021 Change15.1% |
| StateMichigan |
201910.20% |
202011.10% |
202111.70% |
2019-2021 Change14.7% |
| StateOregon |
20198.10% |
20209.40% |
20219.20% |
2019-2021 Change13.6% |
| StateDistrict of Columbia |
201912.50% |
202016.70% |
202114.00% |
2019-2021 Change12.0% |
| StateAlaska |
201910.20% |
202013.30% |
202111.40% |
2019-2021 Change11.8% |
| StateVirginia |
20198.80% |
20207.80% |
20219.80% |
2019-2021 Change11.4% |
| StateWisconsin |
20198.40% |
20208.00% |
20219.30% |
2019-2021 Change10.7% |
| StateMontana |
20199.70% |
202011.00% |
202110.70% |
2019-2021 Change10.3% |
| StateMaryland |
20197.00% |
20209.20% |
20217.70% |
2019-2021 Change10.0% |
| StateWashington |
20197.00% |
20208.30% |
20217.70% |
2019-2021 Change10.0% |
| StateFlorida |
201911.50% |
202013.20% |
202112.60% |
2019-2021 Change9.6% |
| StateUtah |
20197.30% |
20207.40% |
20217.90% |
2019-2021 Change8.2% |
| StateNorth Dakota |
20198.10% |
202010.70% |
20218.50% |
2019-2021 Change4.9% |
| StateIndiana |
201910.10% |
202012.00% |
202110.40% |
2019-2021 Change3.0% |
| StateLouisiana |
201917.90% |
202015.40% |
202118.40% |
2019-2021 Change2.8% |
| StateWyoming |
20199.20% |
20209.80% |
20219.40% |
2019-2021 Change2.2% |
| StateRhode Island |
20199.20% |
20208.50% |
20219.40% |
2019-2021 Change2.2% |
| StateIowa |
20199.50% |
20209.00% |
20219.70% |
2019-2021 Change2.1% |
| StateMassachusetts |
20197.50% |
20208.40% |
20217.60% |
2019-2021 Change1.3% |
| StateNew York |
201912.50% |
202011.80% |
202112.50% |
2019-2021 Change0.0% |
| StateConnecticut |
20198.30% |
202011.20% |
20218.00% |
2019-2021 Change-3.6% |
| StateOhio |
201912.40% |
202012.70% |
202111.60% |
2019-2021 Change-6.5% |
| StateNebraska |
20198.70% |
20208.30% |
20218.10% |
2019-2021 Change-6.9% |
| StateNorth Carolina |
201912.70% |
202013.70% |
202111.80% |
2019-2021 Change-7.1% |
| StateSouth Carolina |
201915.10% |
202013.30% |
202113.70% |
2019-2021 Change-9.3% |
| StateMississippi |
201919.20% |
202017.50% |
202117.40% |
2019-2021 Change-9.4% |
| StateMaine |
201910.40% |
20208.00% |
20219.10% |
2019-2021 Change-12.5% |
| StateVermont |
20198.60% |
20208.60% |
20217.50% |
2019-2021 Change-12.8% |
| StateColorado |
20199.30% |
20209.50% |
20217.90% |
2019-2021 Change-15.1% |
| StateTennessee |
201913.10% |
202013.20% |
202110.60% |
2019-2021 Change-19.1% |
| StateSouth Dakota |
201910.60% |
202011.60% |
20218.40% |
2019-2021 Change-20.8% |
| StateKansas |
20199.50% |
20209.10% |
20217.10% |
2019-2021 Change-25.3% |
Source [1] U.S. Census Bureau, ‘Historical Poverty Tables: People and Families - 1959 to 2021’ https://www.census.gov/data/tables/time-series/demo/income-poverty/historical-poverty-people.html
How poverty affects different demographics
The demographic groups most financially affected by the pandemic are women, young people, Hispanics, and Black people.
Gender and poverty
12.6% of women lived in poverty in the U.S. in 2021, the same as 2020, an increase of 9.6% compared to the previous year (11.5%). The poverty rates also increased for men as a result of the pandemic, from 9.4% in 2019, to 10.5% in 2021, an increase of 11.7%.
While men have seen slightly more of an increase in poverty rates, women are still far more likely to experience poverty in America (12.6% compared to 10.5%).
| Year |
Men |
Women |
| 2019 |
9.40% |
11.50% |
| 2020 |
10.30% |
12.60% |
| 2021 |
10.50% |
12.60% |
Source [1] U.S. Census Bureau, ‘Historical Poverty Tables: People and Families - 1959 to 2021’ https://www.census.gov/data/tables/time-series/demo/income-poverty/historical-poverty-people.html
Age and poverty
For young people (under 18 years), the poverty rates rose from 14.4% in 2019 to 16% in 2020, and then slightly declined to 15.3% in 2021. In recent years, younger people saw the highest levels of poverty in 2010 when 22% were experiencing poverty.
Initial data from 2020 showed that people aged 65 years and older experienced the least significant financial hit during the pandemic as there was 8.9% in poverty in both 2019 and 2020. However, 2021 data shows that this same age group saw an increase of 15.7% with 10.3% of those aged 65 and older in poverty in 2021.
| Age |
2019 |
2020 |
2021 |
| Under 18 years |
14.40% |
16% |
15.30% |
| 18-64 |
9.40% |
10.50% |
10.50% |
| 65 and over |
8.90% |
8.90% |
10.30% |
Source [1] U.S. Census Bureau, ‘Historical Poverty Tables: People and Families - 1959 to 2021’ https://www.census.gov/data/tables/time-series/demo/income-poverty/historical-poverty-people.html
Race and poverty
All races analyzed by the U.S. Census Bureau saw an increase in poverty rates from 2019 to 2021, however, Asian and Hispanic people saw a much sharper rise than other groups.
In 2019, 7.3% of the Asian community experienced poverty which changed to 9.3% in 2021, a 27.4% increase, the highest increase of any race group measured by the U.S. Census Bureau.
For the same time period, the Hispanic population saw a slightly less dramatic change of 8.9% from 15.7% to 17.1%.
White and Black people did not see such a sharp increase in the percentage of the population in poverty from 2019 to 2021, however, both groups did see increases. 18.8% of Black people were experiencing poverty in 2019, compared to 19.5% in 2021, while only 9.1% of white people in 2019 were living in poverty conditions, which changed to 10% in 2021.
| Race |
2019 |
2020 |
2021 |
| Black |
18.8% |
19.6% |
19.5% |
| Hispanic |
15.7% |
17% |
17.1% |
| White |
9.1% |
10.1% |
10% |
| Asian |
7.3% |
8.1% |
9.3% |
| White, not Hispanic |
7.3% |
8.2% |
8.1% |
Source [1] U.S. Census Bureau, ‘Historical Poverty Tables: People and Families - 1959 to 2021’ https://www.census.gov/data/tables/time-series/demo/income-poverty/historical-poverty-people.html
States with the highest poverty rates over time
Between 1980 and 2021, Mississippi has seen the highest poverty rate out of all states for 22 non-consecutive years. New Mexico has topped the list eight times, while Louisiana has ranked highest six times.
Over the past 40 years, Mississippi has seen an average poverty rate of 21.3%, while Louisiana and New Mexico have seen an average poverty rate of 19.95% and 19.63% respectively.
| State |
Average Poverty Rate (%) (1980-2021) |
Number of years state ranks highest for poverty rate (1980-2021) |
| Mississippi |
21.30 |
22 |
| Louisiana |
19.95 |
6 |
| New Mexico |
19.63 |
8 |
| District of Columbia |
18.42 |
3 |
| Arkansas |
17.99 |
1 |
| West Virginia |
17.65 |
1 |
| Alabama |
17.24 |
0 |
| Kentucky |
16.68 |
0 |
| Texas |
16.10 |
0 |
| Tennessee |
15.98 |
0 |
Source [1] U.S. Census Bureau, ‘Historical Poverty Tables: People and Families - 1959 to 2021’ https://www.census.gov/data/tables/time-series/demo/income-poverty/historical-poverty-people.html
States with the lowest poverty rates over time
At an average of 6.87%, New Hampshire is the state with the lowest average poverty rate between 1980-2021. Over the past 41 years, the state has experienced the lowest poverty rate for 27 non-consecutive years however, the state was hit significantly by the pandemic and saw the 12th biggest percentage increase in poverty rates out of all other states at 11.29%.
The state with the second lowest poverty rate is Connecticut with an average poverty rate of 8.53%, followed by New Jersey at 9.06%.
The lowest poverty rate (3.7%) over the past 40 years has been recorded two times, both times in New Hampshire. The first time was in 1986 and the latest was in 2019.
| State |
Average % Poverty Rate 1980-2021 |
Number of years state ranks lowest for poverty rate (1980-2021) |
| New Hampshire |
6.87 |
27 |
| Connecticut |
8.53 |
4 |
| New Jersey |
9.06 |
0 |
| Maryland |
9.11 |
1 |
| Utah |
9.55 |
3 |
| Minnesota |
9.69 |
1 |
| Delaware |
9.90 |
1 |
| Wisconsin |
9.92 |
1 |
| Vermont |
10.01 |
1 |
| Massachusetts |
10.03 |
1 |
Source [1] U.S. Census Bureau, ‘Historical Poverty Tables: People and Families - 1959 to 2021’ https://www.census.gov/data/tables/time-series/demo/income-poverty/historical-poverty-people.html
Poverty rate over time
At 10.5%, 2019 saw the lowest poverty rate in the U.S. since records began, which was quickly reversed by the pandemic. The highest-ever poverty rate nationwide was back in 1959 when 22.4% of the population was living in poverty.
In 2020, the poverty rate saw its sharpest rise since the Great Recession, increasing by one percentage point. This is an increase of 9.5% compared to the previous year to 11.5%, bringing the total number of Americans living in poverty up by 3.3 million people to 37.55 million.
In 2021, 11.6% of Americans were experiencing poverty, a marginal increase from 2020. This equates to around 37.93 million Americans.
Although the pandemic increase is substantial, it is not as large as the increase associated with the Great Recession where the poverty rate rose by 14.4% between 2007 and 2009.
| Year |
Percentage of Americans Experiencing Poverty |
| 2021 |
11.6 |
| 2020 |
11.5 |
| 2019 |
10.5 |
| 2018 |
11.8 |
| 2017 |
12.3 |
| 2016 |
12.7 |
| 2015 |
13.5 |
| 2014 |
14.8 |
| 2013 |
14.5 |
| 2012 |
15 |
| 2011 |
15 |
| 2010 |
15.1 |
| 2009 |
14.3 |
| 2008 |
13.2 |
| 2007 |
12.5 |
| 2006 |
12.3 |
| 2005 |
12.6 |
| 2004 |
12.7 |
| 2003 |
12.5 |
| 2002 |
12.1 |
| 2001 |
11.7 |
| 2000 |
11.3 |
| 1999 |
11.9 |
| 1998 |
12.7 |
| 1997 |
13.3 |
| 1996 |
13.7 |
| 1995 |
13.8 |
| 1994 |
14.5 |
| 1993 |
15.1 |
| 1992 |
14.8 |
| 1991 |
14.2 |
| 1990 |
13.5 |
| 1989 |
12.8 |
| 1988 |
13 |
| 1987 |
13.4 |
| 1986 |
13.6 |
| 1985 |
14 |
| 1984 |
14.4 |
| 1983 |
15.2 |
| 1982 |
15 |
| 1981 |
14 |
| 1980 |
13 |
| 1979 |
11.7 |
| 1978 |
11.4 |
| 1977 |
11.6 |
| 1976 |
11.8 |
| 1975 |
12.3 |
| 1974 |
11.2 |
| 1973 |
11.1 |
| 1972 |
11.9 |
| 1971 |
12.5 |
| 1970 |
12.6 |
| 1969 |
12.1 |
| 1968 |
12.8 |
| 1967 |
14.2 |
| 1966 |
14.7 |
| 1965 |
17.3 |
| 1964 |
19 |
| 1963 |
19.5 |
| 1962 |
21 |
| 1961 |
21.9 |
| 1960 |
22.2 |
| 1959 |
22.4 |
Source [1] U.S. Census Bureau, ‘Historical Poverty Tables: People and Families - 1959 to 2021’ https://www.census.gov/data/tables/time-series/demo/income-poverty/historical-poverty-people.html
Sources

