Tipping waitstaff: How much do people tip?
When out for dinner or drinks, it’s typically expected that you leave your server a tip, and thank them for their service.
However, receiving a tip can make a huge difference to your server's bank balance, with the average waitperson earning a median wage of $12.50 per hour after tips, and in some places, just $2.13 per hour as long as tips reach the federal minimum wage ($7.25 per hour) [1] Waiters and Waitresses https://www.bls.gov/ooh/food-preparation-and-serving/waiters-and-waitresses.htm#tab-5.
To understand more about our relationship with tipping, over 1,000 people were surveyed about their views on tipping, how their tipping habits have changed since the start of the pandemic, and what motivates them to leave a tip.
Key takeaways:
- 61.91% of people say they “always” leave a tip for wait and service staff, with those aged over 55 are the most likely to say they “always” leave a tip
- Current and former hospitality staff are the least likely to automatically tip their servers, 34.45% compared to 51.66% of non-hospitality workers
- 55.37% of people leave a tip of 20% or more, however, just over one in 10 (11.21%) typically leave a tip of 5% or less
- Foodservice staff are more likely to be tipped than bar staff, with 47.27% of people saying they tip food servers more often than bar staff (12.05%)
- Over three-quarters (76.74%) of people believe that wait staff should be paid more to reduce the need and reliance on tipping
- A quarter (25.14%) of people say they are leaving larger tips since before the pandemic, while 17.90% are tipping more frequently
How often are people tipping?
The survey found that when out to eat or drink, fewer than two-thirds (61.91%) of people will always leave tip for their server or staff, with as many as one in 20 (4.82%) saying they rarely or never leave tip.
Responses showed that those aged between 25 and 34 are the least likely to “always” leave a tip (53.38%), while those aged over 55 are the most likely (78.83%). Additionally, adults earning between $40k and $49k were found to be the least likely to “always” leave a tip (46.67%), compared to 85.27% of those that earn over $100k.
There’s even a difference between current and former hospitality workers leaving tips and those that haven’t worked in the industry.
Over two-thirds (68.27%) of non-hospitality workers say they “always” leave a tip, this falls to just over half (55.49%) in those that currently or formerly worked in hospitality.
How much do people leave in tips?
Two-fifths (41.89%) of adults say they typically leave a tip of 20% or more when going out to eat or drink, with 34.01% of people saying they leave a 20% tip and one in 12 (7.88%) saying they typically leave 25% or more.
One in seven (12.97%) of people say that - when they tip - they leave 5% or less than the value of the check.
| Tip Value | Respondents |
|---|---|
| <5% | 2.32% |
| 5% | 10.66% |
| 10% | 15.11% |
| 15% | 30.03% |
| 20% | 34.01% |
| 25% | 5.28% |
| >25% | 2.59% |
What motivates people to leave a tip?
Overall, providing a good service (59.96%) is the best way to get a tip according to respondents, with receiving speedy delivery of food and/or beverages (44.39%) the second biggest motivator for guests to leave a tip.
| Motivator | Respondents |
|---|---|
| If the service is excellent | 59.96% |
| Speed and delivery of food/beverages | 44.39% |
| If the food/beverages are good quality | 42.91% |
| The overall experience in the restaurant/bar is good | 38.28% |
| The cleanliness of the establishment | 33.55% |
| The atmosphere of the establishment | 26.14% |
However, there is a difference between those who have worked in the industry and those who have not.
Current and former hospitality workers are more likely to care about food/beverages quality (50.28%), cleanliness (38.18%), and atmosphere (32.96%) than those who had not previously worked in the industry (35.61%, 28.97%, and 19.37% respectively).
In addition, while some establishments add a service charge within the check, it was found that nearly two out of every five (38.20%) people say that they are less likely to leave a tip when a check includes a service charge. However, one in five (22.75%) do say they’re more likely to leave a tip.
Who do people tip?
When asked about who they typically tip the most, it was found that nearly half of people (47.27%) say they will tip food service staff more often than bar service staff, with just one in eight (12.05%) saying they tip bar staff more.
Cooks, porters, dishwashers, etc. all help to provide the experience we enjoy when out to eat or drink.
When asked how they would react to tips being pooled among workers, 25.76% said they would be less likely to leave a tip, while 26.78% saying they would in fact be more likely.
Additionally, if tips were pooled, a quarter (24.93%) of people say would like them to be shared equally among the front and back of house staff, with 13.44% say they should be given exclusively to the front of house staff, and a further 13.44% say the majority of pooled tips should go to the front of house staff with the remainder going to back of house.
How do people prefer to leave a tip?
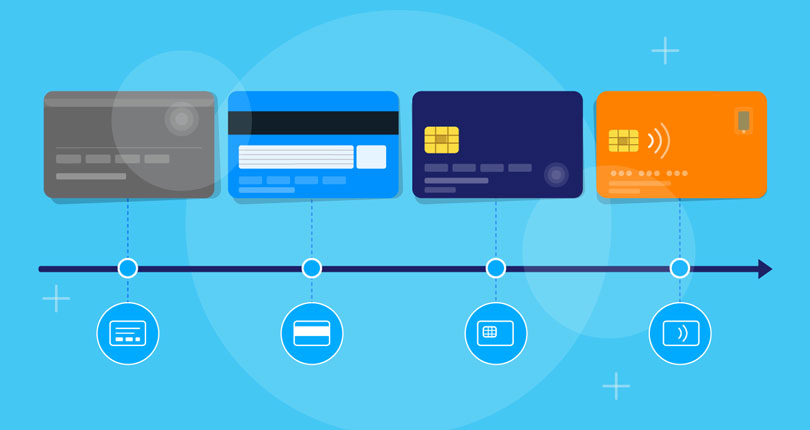
People’s preferences when it comes to how they leave a tip are split quite equally, with 48.93% of people saying they usually leave tips in the form of cash, and 49.21% saying they leave tips by adding the value to a card transaction.
Meanwhile, only one in 50 (1.85%) people say they like to tip wait staff directly via apps like Cash App.
Results found that people over 65 are more likely to leave a tip by adding it to a card transaction (53.33%) when compared to those under 35 (48.31%), with those under 35 preferring to leave a tip in the form of cash more than any other age group (49.98%).
Pandemic impact on tips
In light of the pandemic and its impact on the hospitality industry, respondents were asked whether they were leaving larger tips and more frequently than previously to help those that were out of work or earning less over the past two years.
Results found that a quarter (25.14%) of people say they are leaving larger tips but at the same frequency as before the pandemic, while almost one in five (17.90%) are leaving the same amounts as before the pandemic but are tipping more frequently.
Conversely, three in 50 (6.31%) people say they are leaving lower tips (3.90%) or tipping less often (2.41%). This drop in tips is most notable in those from households that earn less than $50,000 per year, where nearly one in 10 (9.58%) say they have reduced how much they tip (5.71%) and how often (3.88%).
Methodology:
The survey into how, why, and who people tip when out to eat or drink, asked 1,079 adult respondents about their tipping habits and beliefs. Each respondent was asked a series of questions related to how often they leave tips, the amounts they leave their servers, what motivates them to leave a tip, and how or whether tips should be split between workers.
Responses were collected between May 16th, 2022 and May 20th, 2022.
Respondent demographics:
Gender identity
- Female = 58.57%
- Male = 40.59%
- Other/Prefer not to say = 0.83%
Age ranges
- 18 to 24 = 8.53%
- 25 to 34 = 39.76%
- 35 to 44 = 26.69%
- 45 to 54 = 13.53%
- 55 to 64 = 8.71%
- 65 and over = 2.78%
Previously worked in a service hospitality position
- No = 50.23%
- Yes = 49.77%
Sources
- [1] Waiters and Waitresses https://www.bls.gov/ooh/food-preparation-and-serving/waiters-and-waitresses.htm#tab-5