Best-Paying Cities for Single Parents
For decades, single-parent households have been on the rise. According to data from the U.S. Census Bureau, nearly one out of every four families with children under 18 is headed by a single parent.
Single-parent households face a unique set of challenges, and the COVID-19 pandemic has exacerbated many of these. Daycare closures and remote schooling are harder on single parents, and sole-earner households are more vulnerable to job losses.
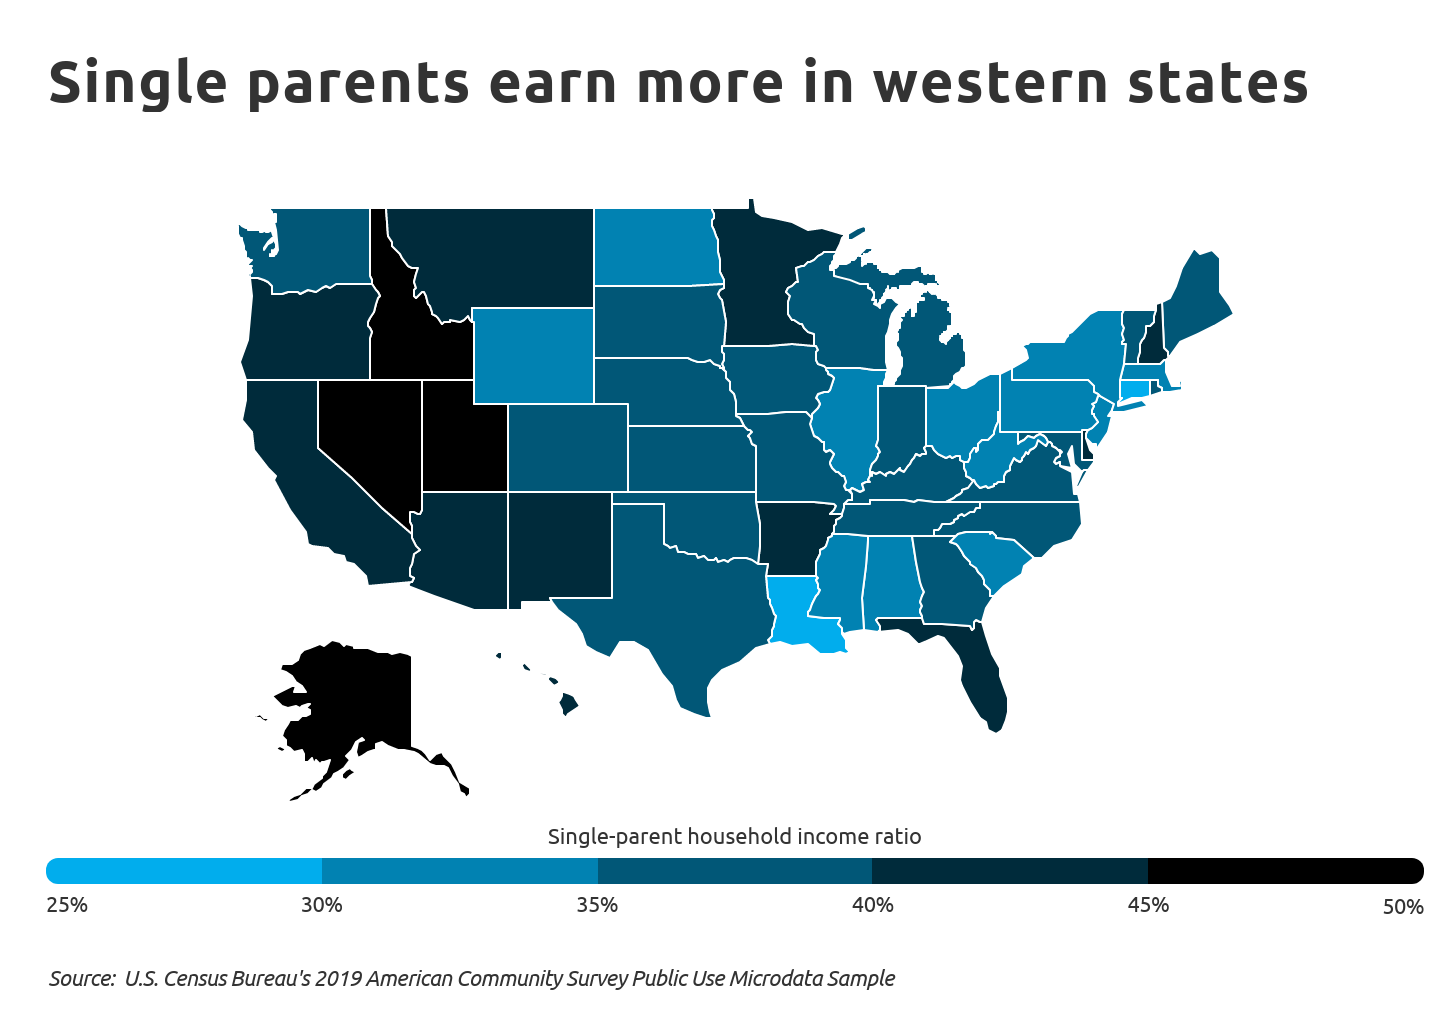
Nationally, Census Bureau data shows that single-parent household income is, on average, just 36% of dual-parent household income, but this ratio varies widely by location.
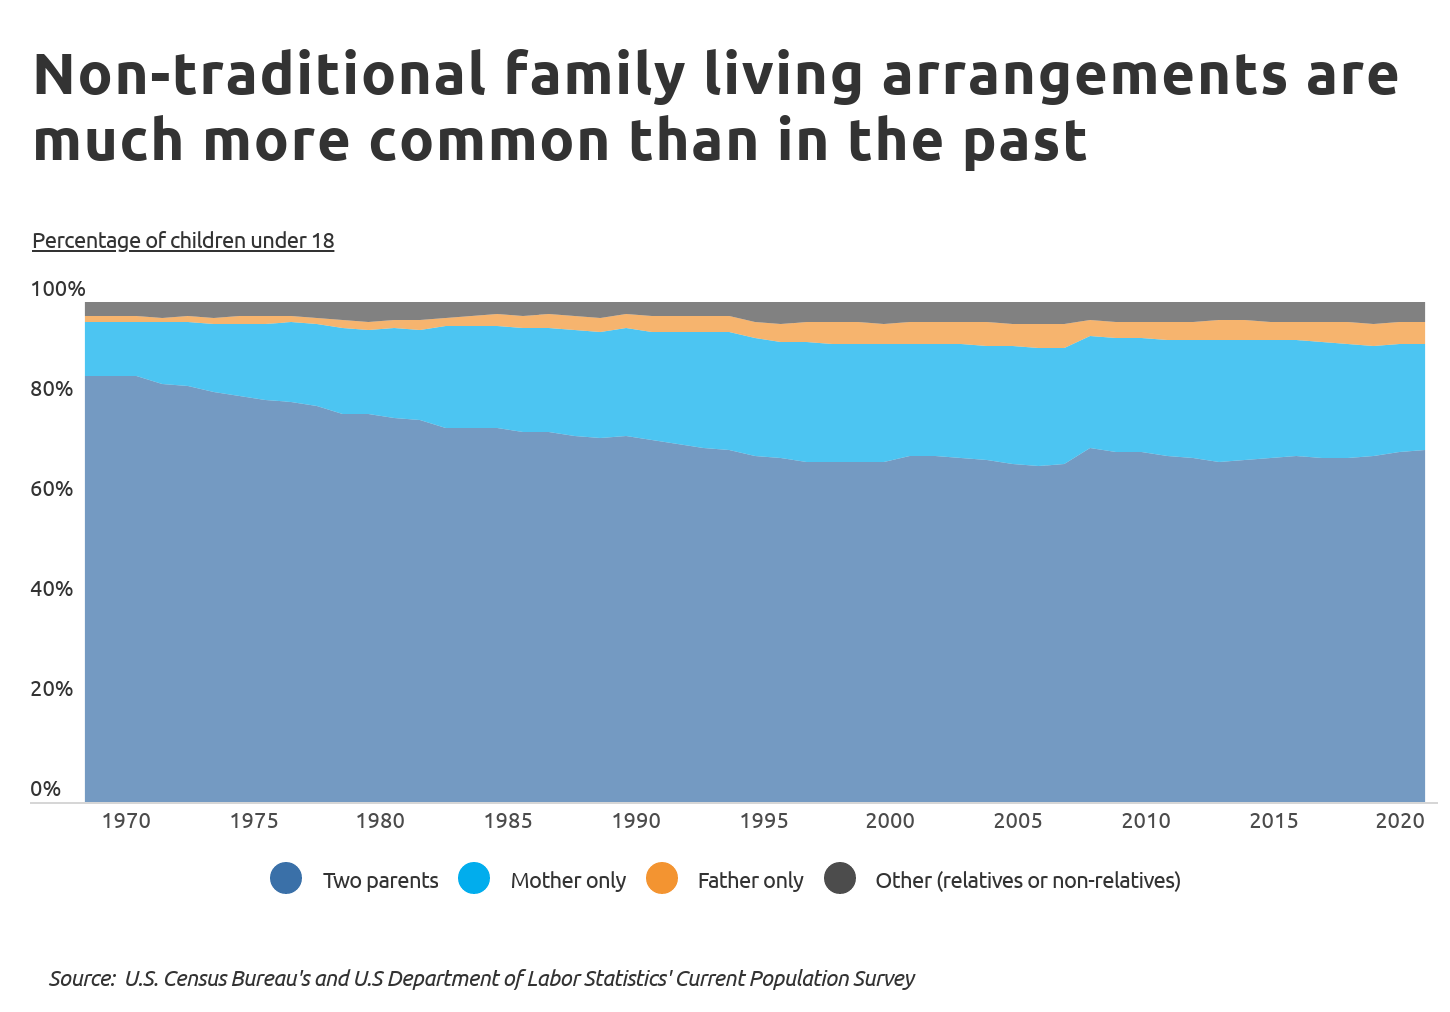
Compared to several decades ago, children under 18 are more than twice as likely to live with a single parent (either mother or father). In 1968, only 12% of children lived with a single parent, most often their mother. Single-father households were extremely uncommon, with just 1% of kids living with a single father in 1968. By 2020, 25% of kids lived in single-parent households, and the share of kids who lived with a single father quadrupled to over 4%. Additionally, the proportion of children under 18 who live with other adults (relatives or non-relatives) has also become more common.
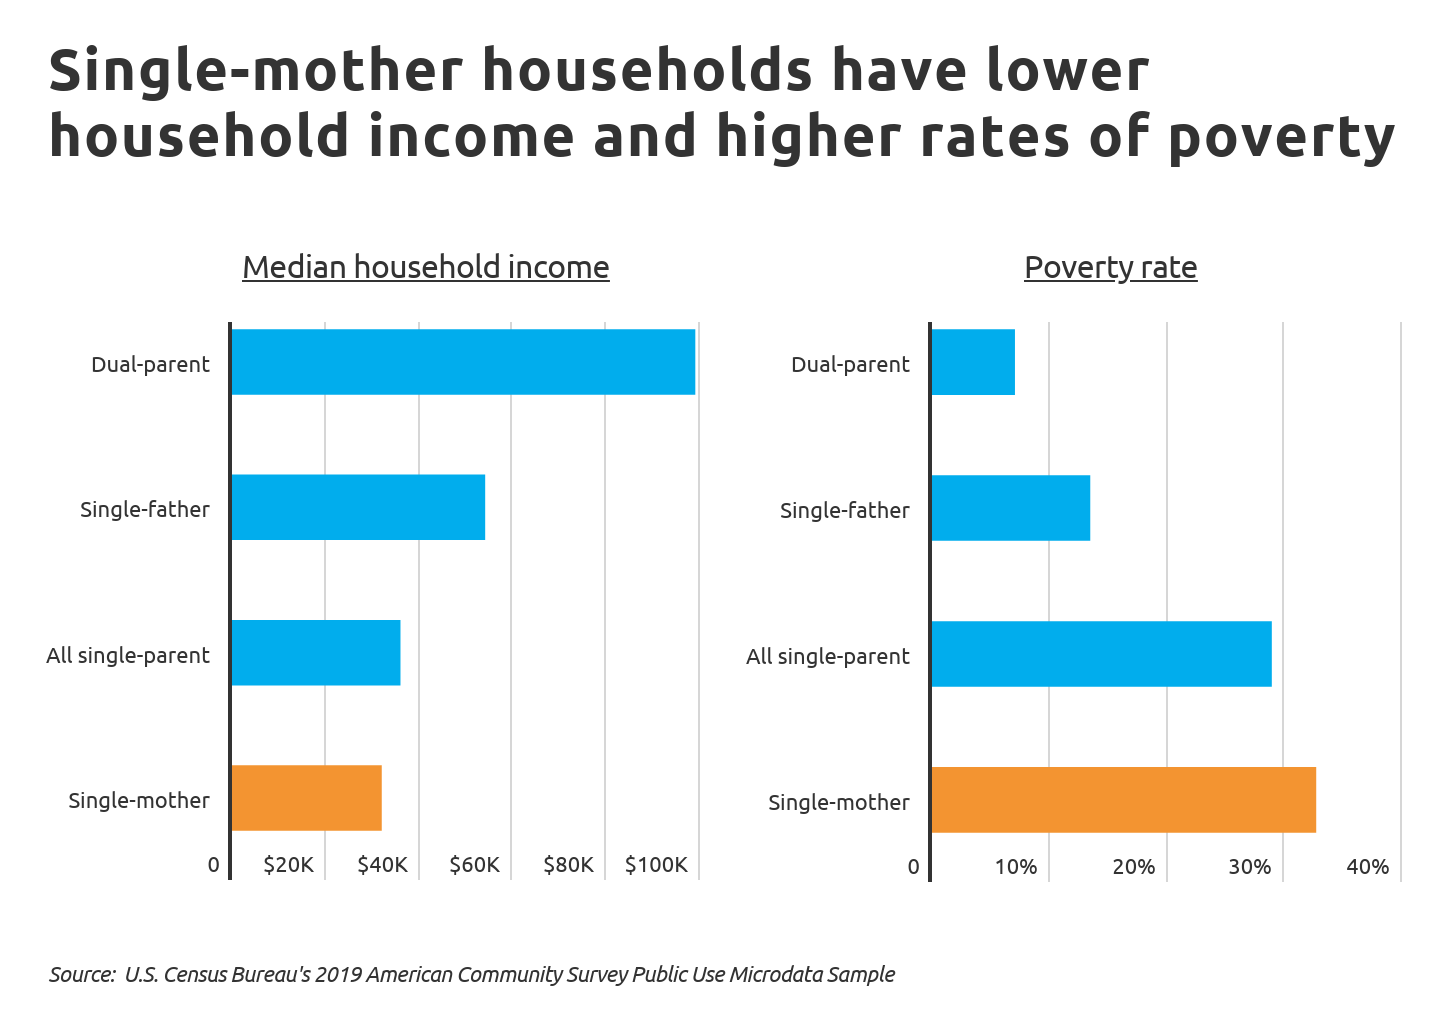
Despite the rise in popularity of non-traditional living arrangements, such arrangements tend to offer less financial stability than dual-parent family structures. The median income of single-parent households is less than half of dual-parent households—$36,000 compared to $99,000. Median income for households with a single mother is even less, at just $32,000 per year. As a result, single-parent households are much more likely to live in poverty: nearly one in three single mothers and one in seven single fathers have income below the poverty line. Comparatively few dual-parent households live in poverty—about one out of every 14, or 7%.
The median income of single-parent households and the differential between single-parent household income and dual-parent household income varies substantially on a geographic basis. At the state level, Idaho and Alaska have the highest single-parent household income ratio. The median ratio of single-parent household income to dual-parent household income in both of these states is nearly one-half—48.8% in Idaho and 47.5% in Alaska. At the opposite end of the spectrum, single-parent household income in Louisiana is just 28% of dual parent household income.
TRENDING
During tough economic times, it’s especially important to stay on top of your credit score. Check out our comprehensive guide on how to build good credit.
To find the best-paying metros for single parents, researchers at Self analyzed data from the U.S. Census Bureau and the Bureau of Economic Analysis. Researchers ranked metro areas according to the single-parent household income ratio, calculated as the ratio of the median income for single-parent households to the median income for dual-parent households. Researchers also calculated the median income for single-mother households, single-father households, the percentage of families with a single parent, and the relative cost of living.
To improve relevance, only metropolitan areas with at least 100,000 people were included in the analysis. Additionally, metro areas were grouped into the following cohorts based on population size:
- Small metros: 100,000–349,999
- Midsize metros: 350,000–999,999
- Large metros: 1,000,000 or more
Best-Paying Large Metros for Single Parents

Photo Credit: Alamy Stock Photo
15. Jacksonville, FL
- Single-parent household income ratio: 39.2%
- Median income for all single-parent households: $36,100
- Median income for single-mother households: $35,000
- Median income for single-father households: $49,500
- Median income for dual-parent households: $92,000
- Percentage of families with a single parent: 26.7%
- Cost of living: 4.6% below average

Photo Credit: Alamy Stock Photo
14. Sacramento--Roseville--Arden-Arcade, CA
- Single-parent household income ratio: 39.5%
- Median income for all single-parent households: $43,200
- Median income for single-mother households: $40,200
- Median income for single-father households: $47,800
- Median income for dual-parent households: $109,500
- Percentage of families with a single parent: 20.9%
- Cost of living: 5.2% above average

Photo Credit: Alamy Stock Photo
13. Washington-Arlington-Alexandria, DC-VA-MD-WV
- Single-parent household income ratio: 41.4%
- Median income for all single-parent households: $60,000
- Median income for single-mother households: $55,000
- Median income for single-father households: $85,000
- Median income for dual-parent households: $145,000
- Percentage of families with a single parent: 21.4%
- Cost of living: 17.4% above average

Photo Credit: Alamy Stock Photo
12. Nashville-Davidson--Murfreesboro--Franklin, TN
- Single-parent household income ratio: 41.5%
- Median income for all single-parent households: $40,700
- Median income for single-mother households: $37,110
- Median income for single-father households: $49,200
- Median income for dual-parent households: $98,000
- Percentage of families with a single parent: 23.9%
- Cost of living: 5.6% below average

Photo Credit: Alamy Stock Photo
11. Dallas-Fort Worth-Arlington, TX
- Single-parent household income ratio: 42.2%
- Median income for all single-parent households: $41,900
- Median income for single-mother households: $36,000
- Median income for single-father households: $67,000
- Median income for dual-parent households: $99,400
- Percentage of families with a single parent: 22.5%
- Cost of living: 1.2% above average

Photo Credit: Alamy Stock Photo
10. San Diego-Carlsbad, CA
- Single-parent household income ratio: 42.6%
- Median income for all single-parent households: $48,100
- Median income for single-mother households: $41,000
- Median income for single-father households: $78,200
- Median income for dual-parent households: $113,000
- Percentage of families with a single parent: 19.7%
- Cost of living: 17.9% above average
DID YOU KNOW?
You have options for building—or rebuilding—your credit. For example, a credit builder loan is an installment loan that exists for the sole purpose of helping you build credit history.

Photo Credit: Alamy Stock Photo
9. Portland-Vancouver-Hillsboro, OR-WA
- Single-parent household income ratio: 42.9%
- Median income for all single-parent households: $48,000
- Median income for single-mother households: $41,800
- Median income for single-father households: $77,500
- Median income for dual-parent households: $112,000
- Percentage of families with a single parent: 19.8%
- Cost of living: 5.0% above average

Photo Credit: Alamy Stock Photo
8. Tucson, AZ
- Single-parent household income ratio: 43.6%
- Median income for all single-parent households: $37,500
- Median income for single-mother households: $35,000
- Median income for single-father households: $40,800
- Median income for dual-parent households: $86,000
- Percentage of families with a single parent: 26.1%
- Cost of living: 6.9% below average

Photo Credit: Alamy Stock Photo
7. Miami-Fort Lauderdale-West Palm Beach, FL
- Single-parent household income ratio: 44.0%
- Median income for all single-parent households: $36,900
- Median income for single-mother households: $33,400
- Median income for single-father households: $60,000
- Median income for dual-parent households: $83,770
- Percentage of families with a single parent: 28.7%
- Cost of living: 11.7% above average

Photo Credit: Alamy Stock Photo
6. Los Angeles-Long Beach-Anaheim, CA
- Single-parent household income ratio: 45.1%
- Median income for all single-parent households: $44,800
- Median income for single-mother households: $40,400
- Median income for single-father households: $69,300
- Median income for dual-parent households: $99,400
- Percentage of families with a single parent: 20.8%
- Cost of living: 18.8% above average

Photo Credit: Alamy Stock Photo
5. Phoenix-Mesa-Scottsdale, AZ
- Single-parent household income ratio: 45.7%
- Median income for all single-parent households: $42,000
- Median income for single-mother households: $39,100
- Median income for single-father households: $57,000
- Median income for dual-parent households: $92,000
- Percentage of families with a single parent: 22.6%
- Cost of living: 1.3% below average

Photo Credit: Alamy Stock Photo
4. Las Vegas-Henderson-Paradise, NV
- Single-parent household income ratio: 47.1%
- Median income for all single-parent households: $39,600
- Median income for single-mother households: $35,000
- Median income for single-father households: $50,000
- Median income for dual-parent households: $84,000
- Percentage of families with a single parent: 27.3%
- Cost of living: 3.1% below average

Photo Credit: Alamy Stock Photo
3. Orlando-Kissimmee-Sanford, FL
- Single-parent household income ratio: 47.6%
- Median income for all single-parent households: $40,000
- Median income for single-mother households: $36,200
- Median income for single-father households: $55,000
- Median income for dual-parent households: $84,000
- Percentage of families with a single parent: 22.6%
- Cost of living: 1.0% below average

Photo Credit: Alamy Stock Photo
2. Riverside-San Bernardino-Ontario, CA
- Single-parent household income ratio: 47.6%
- Median income for all single-parent households: $40,000
- Median income for single-mother households: $36,150
- Median income for single-father households: $50,300
- Median income for dual-parent households: $84,000
- Percentage of families with a single parent: 21.5%
- Cost of living: 7.3% above average
TRENDING
One way to build credit is to use a secured credit card. What is a secured credit card? It’s a credit card that uses a security deposit as collateral.

Photo Credit: Alamy Stock Photo
1. Salt Lake City, UT
- Single-parent household income ratio: 47.7%
- Median income for all single-parent households: $48,200
- Median income for single-mother households: $47,000
- Median income for single-father households: $59,000
- Median income for dual-parent households: $101,100
- Percentage of families with a single parent: 16.7%
- Cost of living: 1.4% below average
Detailed Findings & Methodology
More than half of the large metros with the highest single-parent income ratio are located in the West or Southwest. With a ratio of almost 48%, single-parent households in the Salt Lake City metro area have incomes that are nearly half of dual-parent households. Median single-parent household income is over $48,000 in Salt Lake City, and median single-mother household income is just slightly less, at $47,000. The high single-parent income ratios among these large metros are mainly driven by above-average single mother-household incomes.
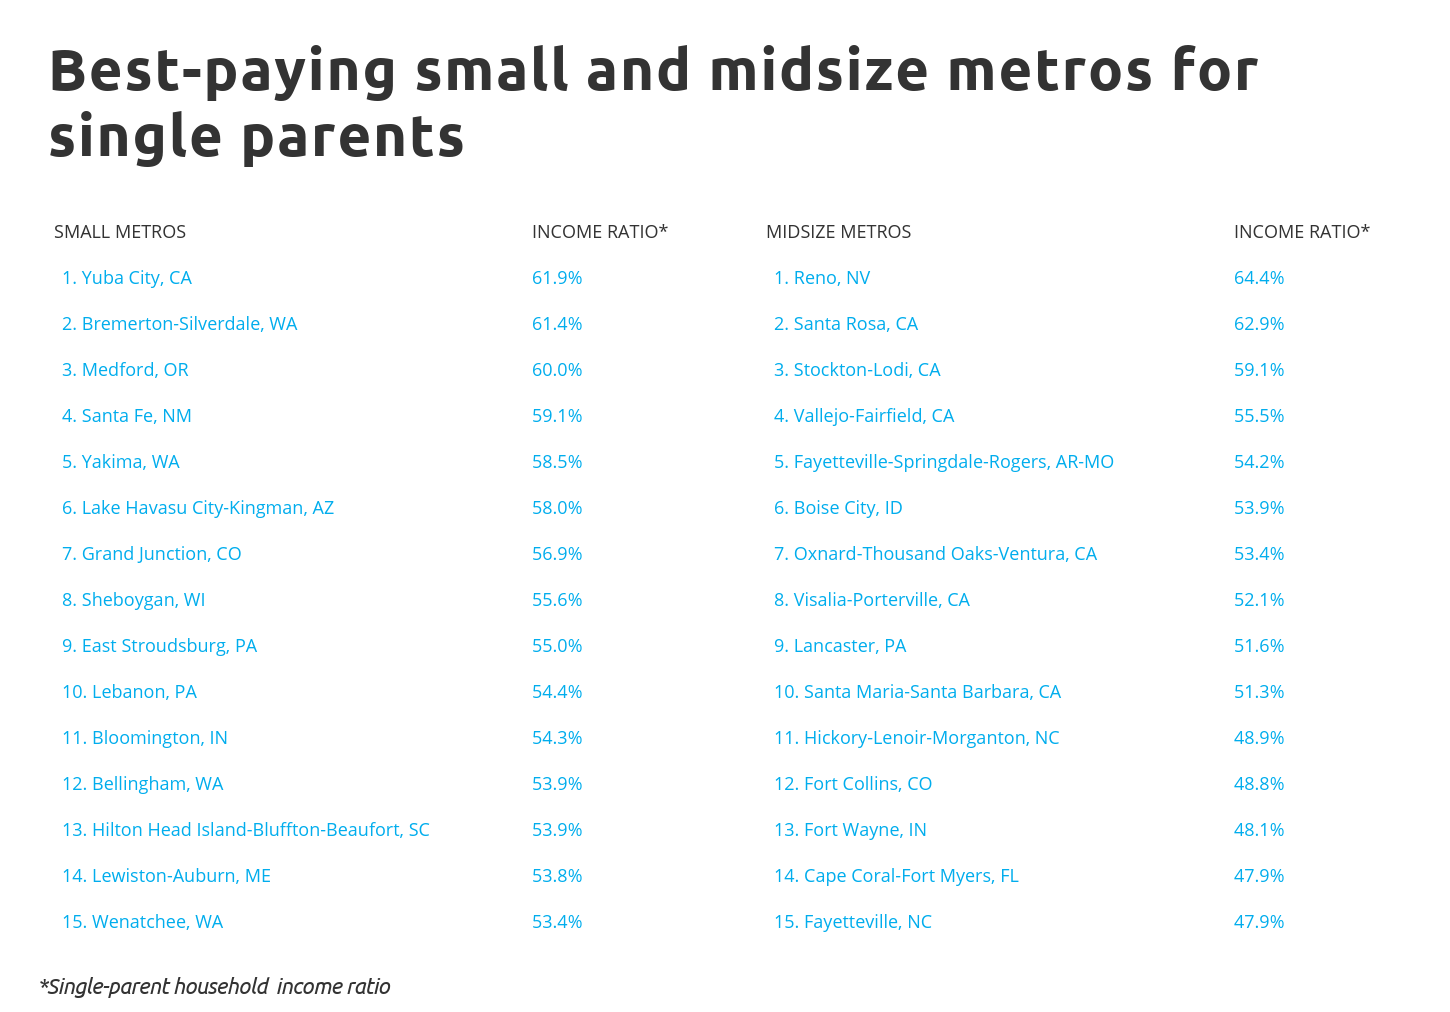
The small and midsize metros with the highest income ratios follow a similar pattern—single-mother household income skews higher while dual-parent household income is on par with the national level or less. Across all metros, the share of families with a single parent varies widely, as does cost of living. The best-paying metros for single parents include both pricey locales on the West Coast and more affordable areas in the Midwest.
To find the best-paying metros for single parents, researchers at Self analyzed data from the U.S. Census Bureau’s 2019 American Community Survey Public Use Microdata Sample (ACS PUMS) and the Bureau of Economic Analysis’s 2019 Regional Price Parity (RPP) dataset. Using the ACS PUMS data, researchers ranked metro areas according to the single-parent household income ratio, calculated as the ratio of the median income for single-parent households to the median income for dual-parent households. In the event of a tie, the metro with the higher median income for single-parent households was ranked higher. From the ACS PUMS, researchers also calculated the median income for single-mother households, single-father households, and the percentage of families with a single parent. The cost-of-living index is from the RPP data. Only households with children under 18 were used in the analysis.
To improve relevance, only metropolitan areas with at least 100,000 people were included in the analysis. Additionally, metro areas were grouped into the following cohorts based on population size:
- Small metros: 100,000–349,999
- Midsize metros: 350,000–999,999
- Large metros: 1,000,000 or more