Research: Rates of Uninsured Americans by City
Efforts to contain the spread of COVID-19 depend on the nation’s ability to provide testing and treatment for all Americans, even the 28.5 million who lack health insurance.
As the number of coronavirus cases rise, issues surrounding access to healthcare and insurance have reached new levels of importance. Unfortunately, after sharp declines in the number of Americans without health insurance following the passage of the Affordable Care Act (ACA) in 2010, the uninsured rate rose for the first time in 2018.
Between 2010 and 2017, the uninsured rate decreased from 15.5 to 8.7 percent. However, new figures from the U.S. Census Bureau place the national uninsured rate at 8.9 percent for 2018—an increase likely due to a variety of factors, including rising premiums, fewer insurers in the ACA exchange, a shortened ACA enrollment period, and the elimination of the ACA’s individual mandate penalty.

While the national overall uninsured rate stands at 8.9 percent, the uninsured rate in different locations and among different demographic groups varies considerably, making certain populations more vulnerable in times of crisis. Americans aged 26 to 34 are the largest uninsured age group, 15.8 percent of whom do not carry a health insurance plan. Thanks to Medicare, people over age 65 have the lowest uninsured rate. Looking at U.S. Census Bureau designations for race and ethnicity, American Indian, Alaskan Natives, Hispanics, and Latinos have the highest uninsured rates, while white and Asian Americans have the lowest uninsured rates.
Among educational attainment levels, individuals with less than a high school degree are the most likely to be without health insurance—21.4 percent are uninsured. Many Americans receive health insurance benefits through their employer, but lower paid, hourly workers are less likely to receive such benefits. Not surprisingly, households in higher income brackets have lower uninsured rates. The uninsured rate for people in households earning less than $49,999 per year is 13.2 percent, more than one and a half times higher than the national rate of 8.9 percent.

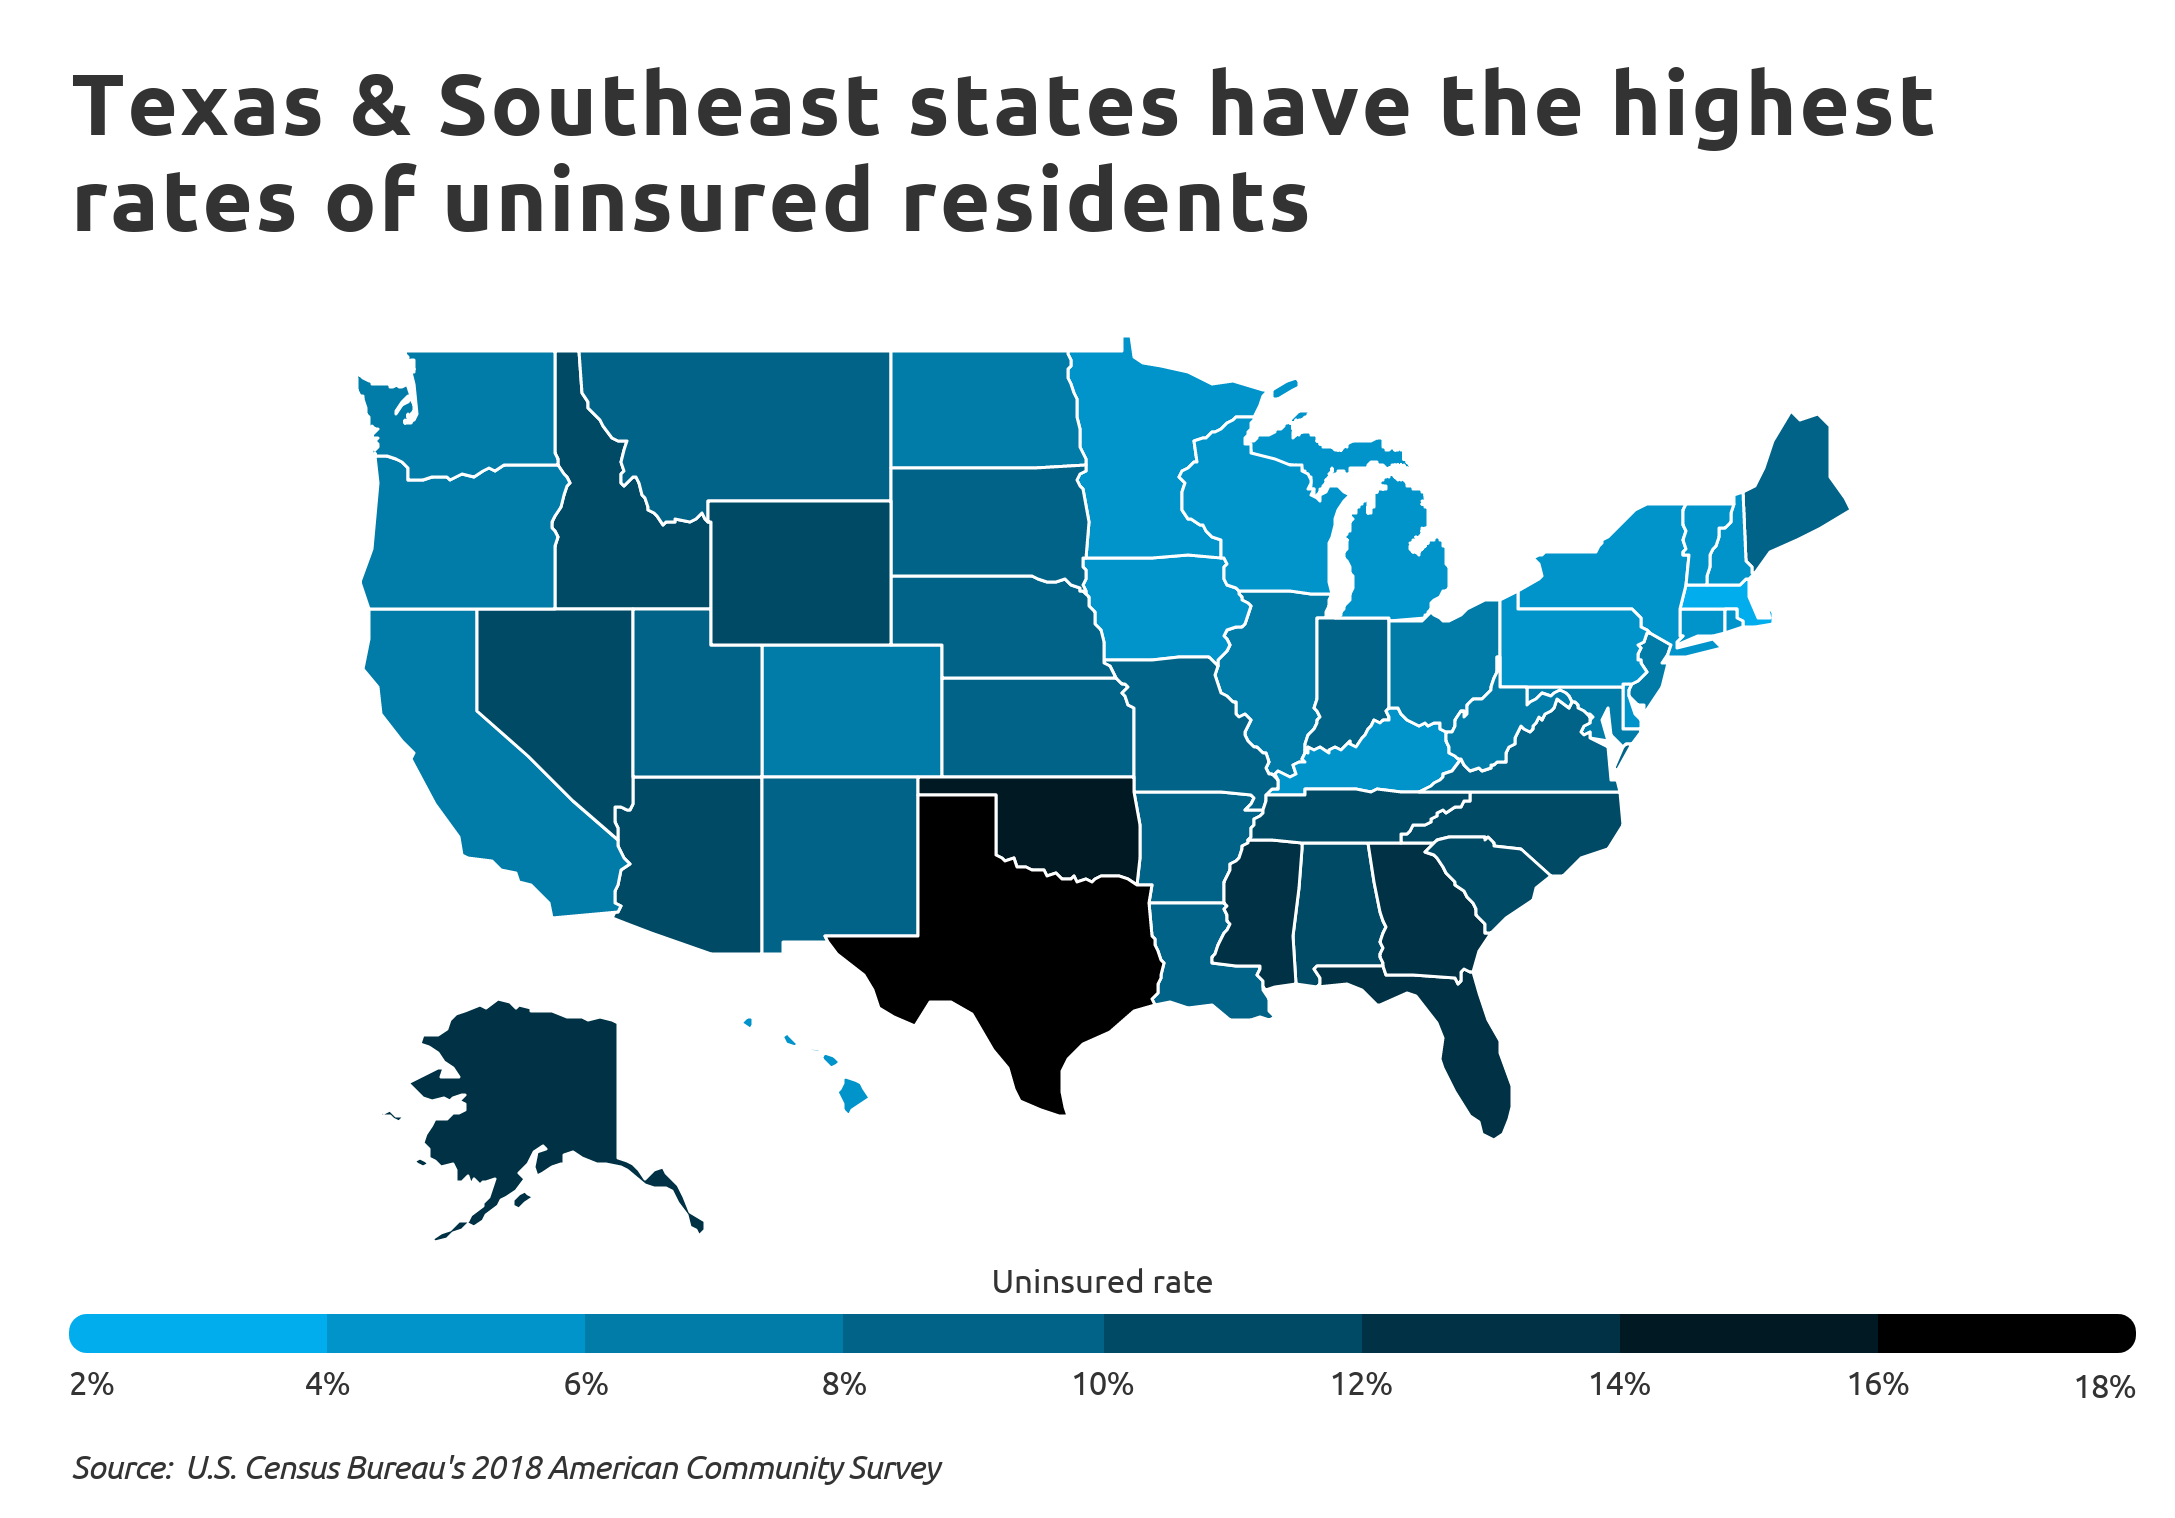
At the state level, Texas has the highest uninsured rate in the country at 17.7 percent, about twice as high as the national rate. Other states in the South and Southeast, including Oklahoma, Florida, and Georgia, also have high rates of uninsured residents. At the other end of the spectrum, Massachusetts has the lowest uninsured rate in the country, with just 2.8 percent of its residents lacking health insurance.
To determine the cities with the highest and lowest uninsured rates, researchers at Self Financial analyzed the latest data from the U.S. Census Bureau's 2018 American Community Survey (ACS) and the Center for Disease Control’s 500 Cities Project. The researchers ranked cities according to the share of residents without health insurance. Researchers also looked at the uninsured rate for individuals below the poverty line, the number of uninsured people, the number of uninsured children, and the percentage of adults reporting good physical health.
To improve relevance, only cities with at least 100,000 people were included in the analysis. Additionally, cities were grouped into the following cohorts based on population size:
- Small cities: 100,000-150,000
- Midsize cities: 150,000-350,000
- Large cities: more than 350,000
Here are the cities with the highest and lowest uninsured rates.

Large Cities With the Highest Uninsured Rates

Photo Credit: Alamy Stock Photo
1. Dallas, TX
- Overall uninsured rate: 24.4%
- Uninsured rate for individuals below the poverty line: 33.5%
- Number of people uninsured: 326,255
- Number of children uninsured: 58,919
- Share of adults reporting good physical health: 86.6%

Photo Credit: Alamy Stock Photo
2. Houston, TX
- Overall uninsured rate: 23.8%
- Uninsured rate for individuals below the poverty line: 32.3%
- Number of people uninsured: 549,935
- Number of children uninsured: 85,210
- Share of adults reporting good physical health: 87.2%
RELATED
During tough economic times, it’s important to stay on top of your credit score. Read through our comprehensive guide on what you can do to build good credit.

Photo Credit: Alamy Stock Photo
3. El Paso, TX
- Overall uninsured rate: 20.9%
- Uninsured rate for individuals below the poverty line: 30.9%
- Number of people uninsured: 140,034
- Number of children uninsured: 19,412
- Share of adults reporting good physical health: 85.8%

Photo Credit: Alamy Stock Photo
4. Miami, FL
- Overall uninsured rate: 20.3%
- Uninsured rate for individuals below the poverty line: 26.6%
- Number of people uninsured: 94,151
- Number of children uninsured: 6,613
- Share of adults reporting good physical health: 83.9%

Photo Credit: Alamy Stock Photo
5. Fort Worth, TX
- Overall uninsured rate: 19.4%
- Uninsured rate for individuals below the poverty line: 31.2%
- Number of people uninsured: 171,935
- Number of children uninsured: 28,259
- Share of adults reporting good physical health: 87.3%

Photo Credit: Alamy Stock Photo
6. Arlington, TX
- Overall uninsured rate: 19.3%
- Uninsured rate for individuals below the poverty line: 32.9%
- Number of people uninsured: 76,415
- Number of children uninsured: 12,263
- Share of adults reporting good physical health: 88.1%

Photo Credit: Alamy Stock Photo
7. San Antonio, TX
- Overall uninsured rate: 17.1%
- Uninsured rate for individuals below the poverty line: 26.2%
- Number of people uninsured: 259,337
- Number of children uninsured: 32,750
- Share of adults reporting good physical health: 86.7%

Photo Credit: Alamy Stock Photo
8. Tulsa, OK
- Overall uninsured rate: 15.7%
- Uninsured rate for individuals below the poverty line: 25.5%
- Number of people uninsured: 62,408
- Number of children uninsured: 8,554
- Share of adults reporting good physical health: 85.8%
RELATED
Is your credit score below average? Using a secured credit card to build credit is an excellent option.

Photo Credit: Alamy Stock Photo
9. Oklahoma City, OK
- Overall uninsured rate: 15.2%
- Uninsured rate for individuals below the poverty line: 25.0%
- Number of people uninsured: 97,266
- Number of children uninsured: 13,704
- Share of adults reporting good physical health: 85.6%

Photo Credit: Alamy Stock Photo
10. Memphis, TN
- Overall uninsured rate: 14.9%
- Uninsured rate for individuals below the poverty line: 20.2%
- Number of people uninsured: 95,652
- Number of children uninsured: 11,957
- Share of adults reporting good physical health: 84.1%
Large Cities With the Lowest Uninsured Rates

Photo Credit: Alamy Stock Photo
1. Washington, DC
- Overall uninsured rate: 3.2%
- Uninsured rate for individuals below the poverty line: 4.9%
- Number of people uninsured: 21,897
- Number of children uninsured: 2,429
- Share of adults reporting good physical health: 91.0%

Photo Credit: Alamy Stock Photo
2. San Francisco, CA
- Overall uninsured rate: 3.5%
- Uninsured rate for individuals below the poverty line: 7.1%
- Number of people uninsured: 30,351
- Number of children uninsured: 2,466
- Share of adults reporting good physical health: 90.7%

Photo Credit: Alamy Stock Photo
3. Boston, MA
- Overall uninsured rate: 3.7%
- Uninsured rate for individuals below the poverty line: 4.4%
- Number of people uninsured: 25,216
- Number of children uninsured: 1,620
- Share of adults reporting good physical health: 89.2%

Photo Credit: Alamy Stock Photo
4. Seattle, WA
- Overall uninsured rate: 4.7%
- Uninsured rate for individuals below the poverty line: 8.3%
- Number of people uninsured: 34,466
- Number of children uninsured: 2,012
- Share of adults reporting good physical health: 91.1%
RELATED
How long it takes to build credit depends on your personal financial situation. Plan on at least six months to establish credit from scratch.

Photo Credit: Alamy Stock Photo
5. San Jose, CA
- Overall uninsured rate: 4.9%
- Uninsured rate for individuals below the poverty line: 11.6%
- Number of people uninsured: 50,054
- Number of children uninsured: 4,648
- Share of adults reporting good physical health: 90.1%

Photo Credit: Alamy Stock Photo
6. Sacramento, CA
- Overall uninsured rate: 5.5%
- Uninsured rate for individuals below the poverty line: 6.9%
- Number of people uninsured: 27,619
- Number of children uninsured: 2,224
- Share of adults reporting good physical health: 87.4%

Photo Credit: Alamy Stock Photo
7. Louisville, KY
- Overall uninsured rate: 5.6%
- Uninsured rate for individuals below the poverty line: 6.4%
- Number of people uninsured: 34,294
- Number of children uninsured: 3,913
- Share of adults reporting good physical health: 84.5%

Photo Credit: Alamy Stock Photo
8. Minneapolis, MN
- Overall uninsured rate: 5.9%
- Uninsured rate for individuals below the poverty line: 8.3%
- Number of people uninsured: 25,034
- Number of children uninsured: 2,393
- Share of adults reporting good physical health: 91.1%

Photo Credit: Alamy Stock Photo
9. Portland, OR
- Overall uninsured rate: 6.0%
- Uninsured rate for individuals below the poverty line: 8.3%
- Number of people uninsured: 38,666
- Number of children uninsured: 3,952
- Share of adults reporting good physical health: 89.1%

Photo Credit: Alamy Stock Photo
10. Baltimore, MD
- Overall uninsured rate: 6.2%
- Uninsured rate for individuals below the poverty line: 9.9%
- Number of people uninsured: 36,715
- Number of children uninsured: 2,935
- Share of adults reporting good physical health: 87.0%
Detailed Findings & Methodology
Out of the top ten large cities with the highest uninsured rates, eight are located in Texas or Oklahoma. With an average uninsured rate of 19.1 percent, over double the national rate, these cities also have high uninsured rates for people below the poverty line as well as large numbers of uninsured children.
Tech hubs and cities with well-educated workforces dominate the list of top 10 large cities with the lowest uninsured rates. With an average uninsured rate of just 4.9 percent, these cities also have far fewer uninsured residents below the poverty line—on average 7.6 percent compared to 28.4 percent for the cities with the highest uninsured rates. Additionally, these cities tend to have a greater share of their residents reporting good physical health. Similar trends apply to small and midsize cities as well.

To determine the cities with the highest and lowest uninsured rates, researchers at Self Financial analyzed the latest data from the U.S. Census Bureau’s 2018 American Community Survey (ACS) and the Center for Disease Control’s 500 Cities Project. Using ACS data, the researchers ranked cities according to the share of residents without health insurance. In the event of a tie, the city with the larger number of uninsured residents was ranked higher. The uninsured rate for individuals below the poverty line, the number of uninsured people, and the number of uninsured children also comes from the ACS. Researchers obtained the percentage of adults reporting good physical health—defined as the share of adults who did not report that their physical health was not good for more than 14 days—from the CDC data.
To improve relevance, only cities with at least 100,000 people were included in the analysis. Additionally, cities were grouped into the following cohorts based on population size:
- Small cities: 100,000-150,000
- Midsize cities: 150,000-350,000
- Large cities: more than 350,000
About the Author
Jeff Smith is the VP of Marketing at Self.