The Best-Paying Cities for Minorities
Protests and civil unrest throughout 2020 and into 2021 have brought renewed attention to issues of racial injustice in the United States. While the current wave of activism has primarily focused on systemic racism in the criminal justice system, racial disparities are present throughout many aspects of American life, including—and especially—the economy.
For example, much has been written in recent years about the racial wealth gap, which is the phenomenon of White households possessing more accumulated wealth than their minority counterparts. By some estimates, the wealth of the median White family is 41 times greater than their Black counterparts and 22 times greater than their Hispanic and LatinX counterparts. When you look at the gap combined with a low credit score, creating generational wealth can feel even more out of reach. A third-party survey by Wakefield Research for Self found that one in three Black Americans with unfavorable credit believe they’re more likely to win the lottery than leave money to their family when they die.
The wealth gap is in large part a reflection of difficulties that racial and ethnic minorities face in the labor market. In the last three months of 2020, the White working-age population had an unemployment rate of 5.8%. In contrast, Asian (6.7%), Hispanic (8.7%), and Black (9.9%) workers each had an unemployment rate exceeding both the rate for White workers and the nationwide figure of 6.5%.
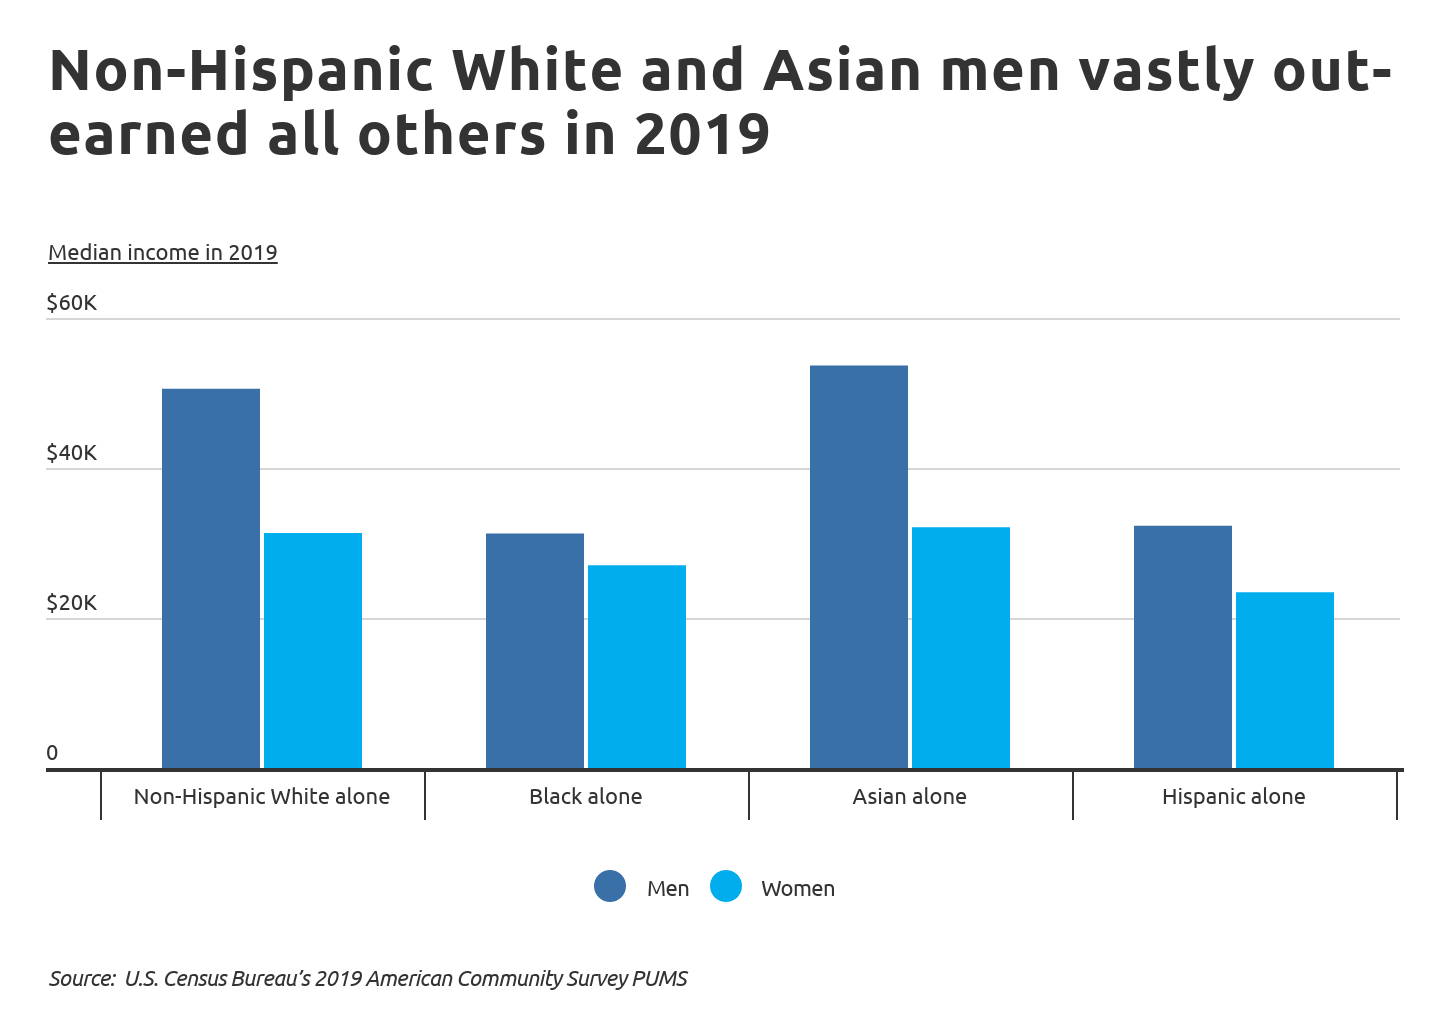
Racial disparities also show up in income. Median income data from 2019 broken down by race and gender indicates that both Asian and White workers out-earn their Black and Asian counterparts. Asian and non-Hispanic White men earn the most at $53,675 and $50,565, respectively. And while women earn less across all racial categories, White and Asian women report incomes roughly on par with Black and Hispanic men.
A combination of factors contributes to these disparities. Certainly inequitable hiring and compensation practices play a role, but other socioeconomic forces are also at play. One is differences in educational attainment. People of Asian descent and non-Hispanic Whites are more likely to have a college degree than Blacks and Hispanics, which strongly contributes to earning potential. Another related factor is racial concentration in industries and occupations. Blacks and Hispanics are more likely to hold jobs in lower-earning fields like agriculture, manufacturing, and social services and to be underrepresented in high-income industries like finance, law, or technology.
One of the most significant factors affecting pay for minority workers is geography. Minority wages can vary by state or city based on the location’s demographic characteristics, variables like the previously mentioned educational attainment levels and industry composition, and other systemic factors contributing to racial economic disparities.
TRENDING
Are you considering a move soon? Read our comprehensive guide on how to build good credit before you apply for a home loan or new apartment lease.
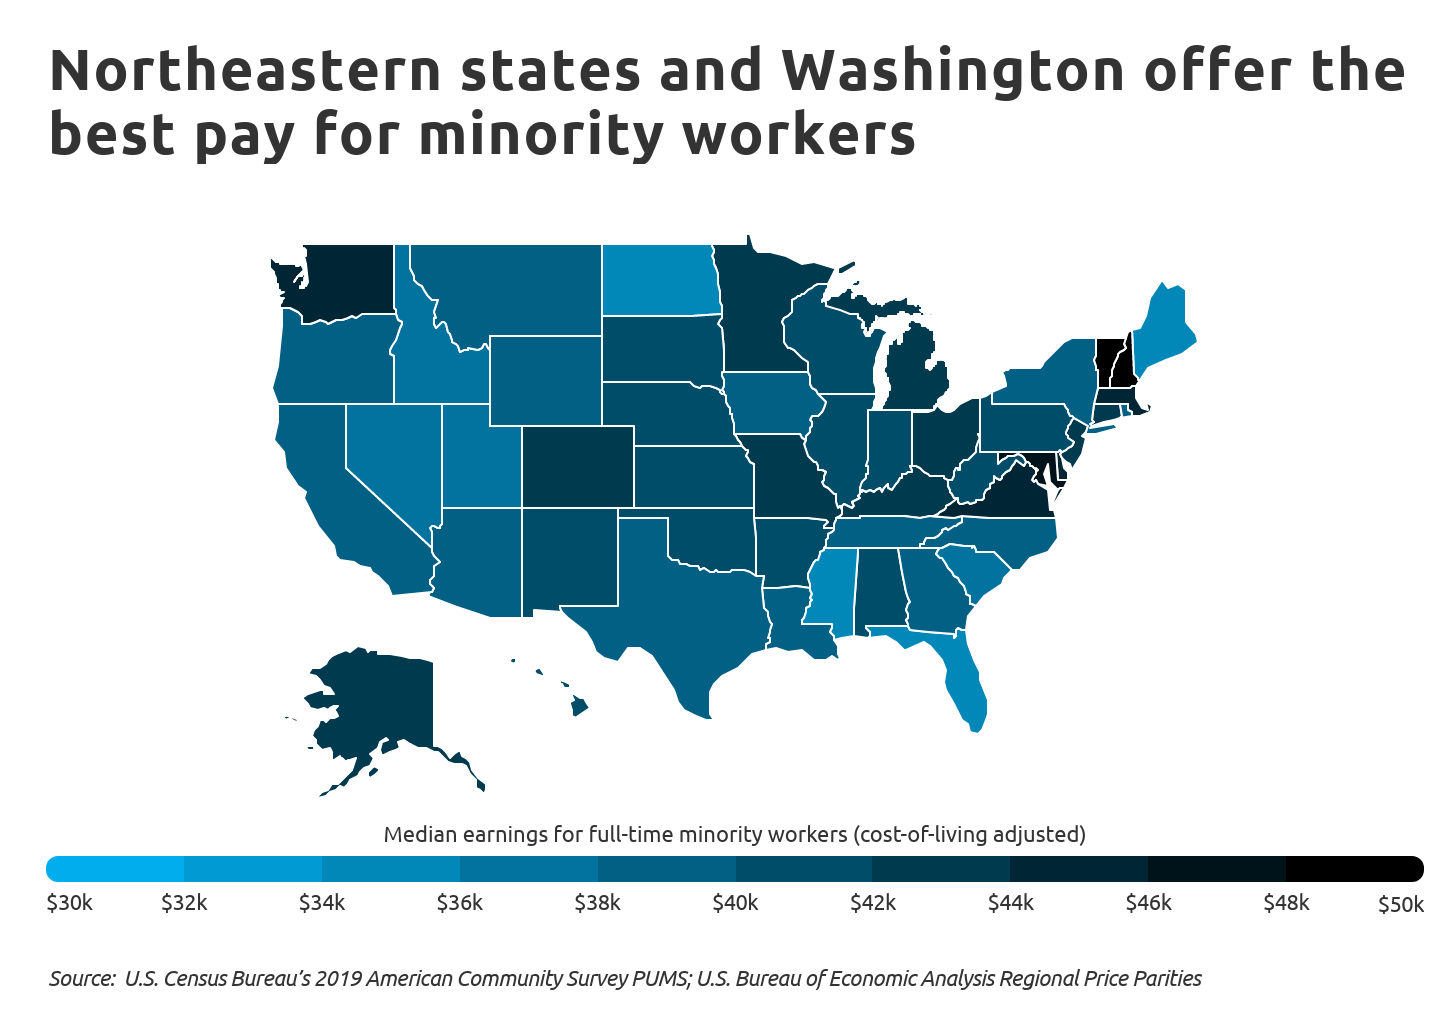
At the state level, the top locations by cost-of-living-adjusted median earnings for full-time minority workers are all in the Mid-Atlantic and New England regions of the northeastern U.S, led by New Hampshire at $48,826. States on the lower end of the spectrum tend to be concentrated in the South and the Mountain West.
Locations with the highest earning potential for racial and ethnic minorities appear to show some combination of high educational attainment, high cost of living, and a strong presence of high-wage industries. This is as true for states as it is for metros, where well-educated, high-cost locations with good jobs, like the Bay Area, Seattle, and the D.C. and Baltimore metros, lead the rankings of the best-paying metropolitan areas for minorities.
To find these locations, researchers at Self used data from the U.S. Census Bureau and U.S. Bureau of Economic Analysis to find median earnings for full-time workers, adjusted for cost of living. For comparison, the researchers also calculated median earnings for all full-time workers and the concentration of minority residents.
Here are the best-paying metropolitan areas for minority workers.
The Best-Paying Large Metros for Minority Workers

Photo Credit: Alamy Stock Photo
15. Philadelphia-Camden-Wilmington, PA-NJ-DE-MD
- Median earnings for full-time minority workers (adjusted): $42,735
- Median earnings for full-time minority workers (actual): $45,000
- Median earnings for all full-time workers (actual): $56,000
- Minority population share: 39.2%
- Cost of living (compared to national average): +5.3%
RELATED
Is your credit score not quite where you want it? Using a secured credit card to build credit might be a great option for you.
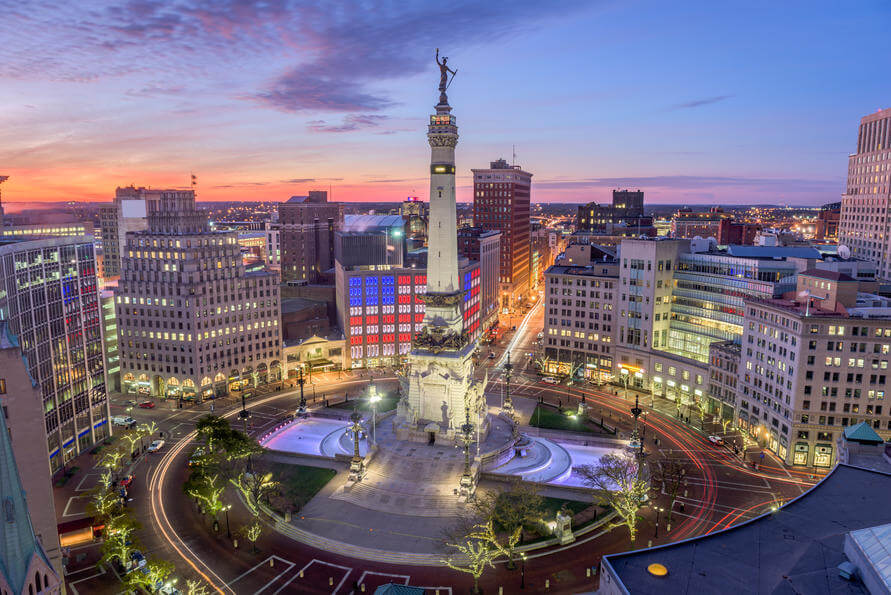
Photo Credit: Alamy Stock Photo
14. Indianapolis-Carmel-Anderson, IN
- Median earnings for full-time minority workers (adjusted): $42,810
- Median earnings for full-time minority workers (actual): $39,000
- Median earnings for all full-time workers (actual): $48,000
- Minority population share: 28.6%
- Cost of living (compared to national average): -8.9%

Photo Credit: Alamy Stock Photo
13. Kansas City, MO-KS
- Median earnings for full-time minority workers (adjusted): $43,103
- Median earnings for full-time minority workers (actual): $40,000
- Median earnings for all full-time workers (actual): $50,000
- Minority population share: 27.7%
- Cost of living (compared to national average): -7.2%

Photo Credit: Alamy Stock Photo
12. Boston-Cambridge-Newton, MA-NH
- Median earnings for full-time minority workers (adjusted): $43,290
- Median earnings for full-time minority workers (actual): $50,000
- Median earnings for all full-time workers (actual): $66,000
- Minority population share: 30.6%
- Cost of living (compared to national average): +15.5%

Photo Credit: Alamy Stock Photo
11. Denver-Aurora-Lakewood, CO
- Median earnings for full-time minority workers (adjusted): $43,378
- Median earnings for full-time minority workers (actual): $45,200
- Median earnings for all full-time workers (actual): $59,000
- Minority population share: 36.6%
- Cost of living (compared to national average): +4.2%

Photo Credit: Alamy Stock Photo
10. St. Louis, MO-IL
- Median earnings for full-time minority workers (adjusted): $43,729
- Median earnings for full-time minority workers (actual): $39,400
- Median earnings for all full-time workers (actual): $50,000
- Minority population share: 26.6%
- Cost of living (compared to national average): -9.9%

Photo Credit: Alamy Stock Photo
9. Cincinnati, OH-KY-IN
- Median earnings for full-time minority workers (adjusted): $44,150
- Median earnings for full-time minority workers (actual): $40,000
- Median earnings for all full-time workers (actual): $50,000
- Minority population share: 21.6%
- Cost of living (compared to national average): -9.4%

Photo Credit: Alamy Stock Photo
8. San Francisco-Oakland-Hayward, CA
- Median earnings for full-time minority workers (adjusted): $44,610
- Median earnings for full-time minority workers (actual): $60,000
- Median earnings for all full-time workers (actual): $75,000
- Minority population share: 61.4%
- Cost of living (compared to national average): +34.5%

Photo Credit: Alamy Stock Photo
7. Sacramento--Roseville--Arden-Arcade, CA
- Median earnings for full-time minority workers (adjusted): $45,437
- Median earnings for full-time minority workers (actual): $47,800
- Median earnings for all full-time workers (actual): $55,000
- Minority population share: 48.7%
- Cost of living (compared to national average): +5.2%

Photo Credit: Alamy Stock Photo
6. Pittsburgh, PA
- Median earnings for full-time minority workers (adjusted): $45,455
- Median earnings for full-time minority workers (actual): $42,000
- Median earnings for all full-time workers (actual): $50,000
- Minority population share: 15.4%
- Cost of living (compared to national average): -7.6%

Photo Credit: Alamy Stock Photo
5. Hartford-West Hartford-East Hartford, CT
- Median earnings for full-time minority workers (adjusted): $45,854
- Median earnings for full-time minority workers (actual): $47,000
- Median earnings for all full-time workers (actual): $60,000
- Minority population share: 34.4%
- Cost of living (compared to national average): +2.5%

Photo Credit: Alamy Stock Photo
4. Washington-Arlington-Alexandria, DC-VA-MD-WV
- Median earnings for full-time minority workers (adjusted): $46,848
- Median earnings for full-time minority workers (actual): $55,000
- Median earnings for all full-time workers (actual): $70,000
- Minority population share: 56.1%
- Cost of living (compared to national average): +17.4%

Photo Credit: Alamy Stock Photo
3. Baltimore-Columbia-Towson, MD
- Median earnings for full-time minority workers (adjusted): $47,259
- Median earnings for full-time minority workers (actual): $50,000
- Median earnings for all full-time workers (actual): $60,000
- Minority population share: 45.1%
- Cost of living (compared to national average): +5.8%
TRENDING
Employers may want to access your credit profile when you apply for a job. So, can you get a job with bad credit? The answer depends on the employer.

Photo Credit: Alamy Stock Photo
2. Seattle-Tacoma-Bellevue, WA
- Median earnings for full-time minority workers (adjusted): $48,908
- Median earnings for full-time minority workers (actual): $56,000
- Median earnings for all full-time workers (actual): $65,000
- Minority population share: 38.3%
- Cost of living (compared to national average): +14.5%
Photo Credit: Alamy Stock Photo
1. San Jose-Sunnyvale-Santa Clara, CA
- Median earnings for full-time minority workers (adjusted): $59,195
- Median earnings for full-time minority workers (actual): $75,000
- Median earnings for all full-time workers (actual): $85,000
- Minority population share: 69.6%
- Cost of living (compared to national average): +26.7%
Detailed Findings & Methodology
The data used in this analysis is from the U.S. Census Bureau’s 2019 American Community Survey PUMS and the U.S. Bureau of Economic Analysis Regional Price Parities. Median earnings for full-time workers were adjusted for cost of living using the Regional Price Parities dataset. Locations were ordered by cost-of-living adjusted median earnings for full-time minority workers. In the event of a tie, actual earnings were used to break the tie.
For the purpose of this analysis, full-time workers were defined as those aged 16 or over with positive earnings that usually worked 35 hours or more per week, 50–52 weeks per year. All individuals not identifying as non-Hispanic White were considered to be among minority groups.
To improve relevance, only metropolitan areas with at least 100,000 residents were included. Additionally, metros were grouped into cohorts based on population size: small (100,000–349,999), midsize (350,000–999,999), and large (1,000,000 or more).
About the author
Lauren Bringle is an Accredited Financial Counselor® with Self Financial – a financial technology company with a mission to increase economic inclusion by helping people build credit and savings. Connect with her on Linkedin or Twitter.