Lost Value: Household Products That Depreciate In Value Most

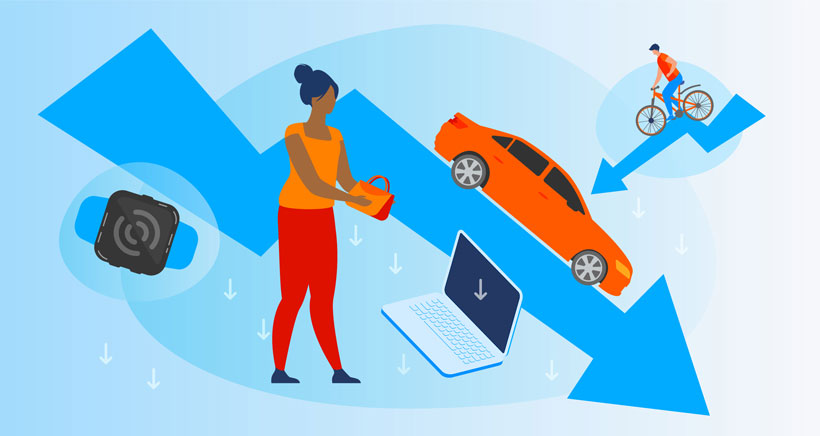
New models of our favorite products and brands generally get released every 6 to 12 months, making products that people have often saved up for soon out of date. This means often perfectly good items either go into the junk drawer or trash within a few years, and represent a significant loss of household value.
But how much can you get for your older items and which items keep their values the longest? We looked at 22 popular re-sold household items and analyzed the original retail price (RRP) of the top products in 2016, 2018, and 2020, and how much they are being sold for on eBay today (2021) - giving people an idea on which items are the biggest, and least, value losers.
Products that lose the most value?
Products lose value and depreciate at different rates, with the most popular mobile phones in 2020 losing 42.7% of their value in just one year (2021). In comparison, the most popular cars being retailed in 2020 have lost just 19.11% of their value, making them an overall better financial decision.
Analyzing five of the most popular products from each category, we are able to reveal the average lost value - from original retail price to current resale price. The table below shows how much value has been lost (on average) for items bought each year.
How much value do products lose on average (%)?
| 2016 | 2018 | 2020 | |
|---|---|---|---|
| Product Categories | Change from 2016 - 2021 (%) | Change from 2018 - 2021 (%) | Change from 2020 - 2021 (%) |
| Mobile phones | 79.96% | 57.14% | 42.70% |
| Smartwatches | 63.13% | 51.42% | 41.71% |
| Headphones | 59.36% | 49.61% | 44.69% |
| Smart speakers | 62.52% | 49.59% | 27.22% |
| Tablets | 59.23% | 51.25% | 28.57% |
| TV Streaming devices | 62.05% | 35.05% | 34.86% |
| Vacuum cleaners | 64.99% | 36.14% | 24.65% |
| Microwaves | 56.06% | 43.10% | 25.70% |
| Computers | 54.88% | 43.64% | 24.53% |
| Computer monitors | 59.24% | 25.11% | 32.50% |
| Baby strollers | 41.34% | 37.54% | 36.99% |
| Laptops | 42.47% | 50.47% | 22.90% |
| Shavers | 41.92% | 37.34% | 36.18% |
| Straighteners | 43.21% | 41.55% | 28.96% |
| Bicycles | 27.67% | 38.24% | 37.97% |
| Handbags | 43.68% | 33.11% | 21.58% |
| External hard drives | 43.40% | 27.63% | 26.48% |
| Game consoles | 37.27% | 32.22% | 27.79% |
| Hairdryers | 31.92% | 31.91% | 27.99% |
| BBQs | 18.65% | 35.83% | 29.75% |
| TVs | 33.49% | 20.49% | 29.56% |
| Cars | 33.00% | 27.05% | 19.11% |
As the chart shows, the value for products (in most cases) steadily decreases over time, with items such as mobile phones losing 43% of their value in the first year, 57% in three years, and almost 80% in five years.
Similarly, smartwatches and headphones lose over two-fifths (40%+) of their value within the first year, with the most popular headphones retailed in 2020 losing nearly 45% of their value in just 12 months when reviewing eBay data.
It’s worth noting that many of the items, especially those within one year of their retail dates, are in good working order so for those looking to find good deals on popular items, holding back a while could be an excellent strategy to save money.
The most popular cars in 2020 lost less than 20% of their value of the past year, with the most popular cars retailing for an average of $38,003 in 2020 and the same models a year later (2021) retailing for $30,740.
How much value do products lose on average ($)?
Unsurprisingly, the products we analyzed each have different initial monetary values.
The most popular cars, for instance, averaged a retail price of over $38,460 across the years analyzed, while the most popular hair straighteners between 2016 and 2020 retailed for just under $110; highlighting that the percentage drop can translate differently in total dollar change.
The tables below show the average original prices for each of the product categories in their respective year, the average used resale price today (2021), and the monetary change between them.
| Product Categories | Avg Original Retail Cost (2016) | Avg Used-Resale Cost (2021) | Avg Change In Value ($) |
|---|---|---|---|
| Baby strollers | $149.95 | $87.96 | -$61.99 |
| BBQ | $145.73 | $118.55 | -$27.18 |
| Bicycles (mountain/other) | $2,245.79 | $1,624.28 | -$621.52 |
| Cars | $47,661.00 | $31,934.00 | -$15,727.00 |
| Computer monitor | $435.39 | $177.47 | -$257.92 |
| Computers | $1,050.39 | $473.98 | -$576.41 |
| External hard drive | $102.79 | $58.18 | -$44.61 |
| Game consoles | $379.99 | $238.37 | -$141.62 |
| Hairdryers | $131.99 | $89.86 | -$42.13 |
| Handbags | $152.60 | $85.95 | -$66.65 |
| Headphones | $159.99 | $65.02 | -$94.97 |
| Laptops | $1,323.73 | $761.57 | -$562.16 |
| Microwave | $198.39 | $87.18 | -$111.21 |
| Mobile Phones | $431.79 | $86.54 | -$345.25 |
| Shavers | $237.39 | $137.87 | -$99.52 |
| Smart speakers | $111.84 | $41.91 | -$69.93 |
| Smart Watches | $173.54 | $63.99 | -$109.55 |
| Straighteners | $47.59 | $27.02 | -$20.57 |
| Tablets | $492.73 | $200.88 | -$291.85 |
| TV Streaming devices | $145.79 | $55.33 | -$90.46 |
| TVs | $785.99 | $522.79 | -$263.20 |
| Vacuum cleaners | $480.99 | $168.39 | -$312.60 |
| Product Categories | Avg Original Retail Cost (2018) | Avg Used-Resale Cost (2021) | Avg Change In Value ($) |
|---|---|---|---|
| Baby strollers | $307.99 | $192.36 | -$115.63 |
| BBQ | $199.59 | $128.09 | -$71.51 |
| Bicycles (mountain/other) | $3,959.00 | $2,445.15 | -$1,513.85 |
| Cars | $29,717.00 | $21,679.76 | -$8,037.24 |
| Computer monitor | $447.19 | $334.91 | -$112.28 |
| Computers | $1,169.99 | $659.36 | -$510.63 |
| External hard drive | $100.99 | $73.08 | -$27.91 |
| Game concoles | $375.79 | $254.71 | -$121.08 |
| Hairdryers | $127.99 | $87.15 | -$40.84 |
| Handbags | $46.33 | $30.99 | -$15.34 |
| Headphones | $239.79 | $120.84 | -$118.96 |
| Laptops | $1,211.60 | $600.08 | -$611.51 |
| Microwave | $167.99 | $95.59 | -$72.40 |
| Mobile Phones | $434.49 | $186.21 | -$248.28 |
| Shavers | $81.76 | $51.23 | -$30.52 |
| Smart speakers | $225.79 | $113.83 | -$111.97 |
| Smart Watches | $251.59 | $122.23 | -$129.37 |
| Straighteners | $95.19 | $55.64 | -$39.55 |
| Tablets (iPads) | $765.80 | $373.30 | -$392.49 |
| Tv tops (fire stick etc) | $131.99 | $85.72 | -$46.27 |
| TVs | $698.59 | $555.42 | -$143.16 |
| Vacuum cleaners | $383.19 | $244.69 | -$138.50 |
| Product Categories | Avg Original Retail Cost (2020) | Avg Used-Resale Cost (2021) | Avg Change In Value ($) |
|---|---|---|---|
| Baby strollers | $359.99 | $226.83 | -$133.16 |
| BBQ | $118.70 | $83.39 | -$35.31 |
| Bicycles (mountain/other) | $2,755.60 | $1,709.28 | -$1,046.32 |
| Cars | $38,003.60 | $30,740.09 | -$7,263.51 |
| Computer monitor | $581.99 | $392.83 | -$189.16 |
| Computers | $1,565.79 | $1,181.66 | -$384.13 |
| External hard drive | $147.47 | $108.43 | -$39.05 |
| Game concoles | $329.99 | $238.28 | -$91.71 |
| Hairdryers | $28.51 | $20.53 | -$7.98 |
| Handbags | $48.94 | $38.38 | -$10.56 |
| Headphones | $135.25 | $74.81 | -$60.44 |
| Laptops | $608.35 | $469.03 | -$139.32 |
| Microwave | $213.99 | $158.99 | -$55.00 |
| Mobile Phones | $731.41 | $419.08 | -$312.34 |
| Shavers | $161.59 | $103.13 | -$58.46 |
| Smart speakers | $415.99 | $302.74 | -$113.25 |
| Smart Watches | $224.77 | $131.01 | -$93.76 |
| Straighteners | $186.39 | $132.41 | -$53.98 |
| Tablets (iPads) | $750.56 | $536.12 | -$214.44 |
| Tv tops (fire stick etc) | $75.99 | $49.50 | -$26.49 |
| TVs | $1,109.99 | $781.86 | -$328.13 |
| Vacuum cleaners | $500.99 | $377.48 | -$123.51 |
As the charts show, cars lose the most in terms of monetary value, with the top-selling cars in 2016 losing over $15,000 in value by 2021 and between 2020 and our analysis (2021) over $7,000. The most popular bicycles experience the second-biggest loss, with the average monetary values of the top bikes sold last year falling by over $1,000.
In comparison, hair dryers sold last year (2020) have lost an average value of less than $8, with handbags (non-designer) losing an average value of just over $10 in a year.
Maximizing the value
As our data shows, products, devices, and ‘assets’ all see different value changes; and it’s worth noting that our analysis could not account for the quality of products in each year or general consumer trends.
However, the data does indicate that many of the tech products people save up for and await the newest releases could be losing the most value. The ever-increasing flow of new products, accessories, and software updates inspires greater levels of purchasing but also a sharper drop in value.
As our data shows, sellers of mobile phones purchased three years ago (2018) have lost over half (57%) of the initial value at the time of purchase, with those that bought the likes of the iPhone 12 or Samsung Galaxy S20 estimated to have lost 42% of their value.
On the other hand, for those looking to buy tech, great deals can be had by waiting a year or so. Our average results of the most popular products showed that waiting a year for a new phone could save you $312, which could use to supplement savings or other necessary purchases such as food and clothing.
Tips For Sellers
To help those looking to sell products they no longer need, or are buying an updated version of, here are some ideas to help maximize the value of your assets:
- Review how much other items are selling for - Trying to sell without checking what others are selling for (and paying) means you could easily undersell your goods, or struggle to sell them if you’re aiming too high
- Search for your product online and see whether it is worth above the market value - Defects, first editions, and general trends can make items that seem trivial worth quite a lot. Our recent look 90s collectibles found a number of surprising items selling for $000s
- Make sure your items aren’t damaged - Check to make sure your items aren’t damaged and could lead to a dispute with a buyer, as this will reduce the overall value and bad reviews could impact any future sales
- Understand your buyers - In the case of headphones (i.e AirPods) it’s not uncommon for people to lose one and need a single replacement, as such you can find additional value in selling one at a premium to inflate the overall value
- Look to pay outright when buying - To avoid paying for items that have already lost value, when buying try to pay outright rather than on credit schemes, this can help to budget your purchases; and should you need to sell an item you won’t be paying for something that is no longer used or in your possession
Tips For Buyers
To help those looking to buy used products, here are ideas to help maximize your buying power and get the best value deal on used items:
- Avoid impulse buying - Before buying anything, check to see if A) you need it then and now and B) that deals can’t be found elsewhere for cheaper. Do a few searches for coupons, deals, or apps that help you save money before spending anything.
- Wait before you buy - With new products coming out so regularly it’s tempting to always chase the next new thing, but, as our study found, perfectly good items can be bought for a fraction of the price just a year later.
- Look to buy after new launches - When buying second-hand items, look to buy shortly after new releases have been launched. Often those “have to have” the latest items will flood marketplaces with perfectly good used items at a greater discount due to the influx of listings and often using the money to fund a new purchase.
- Check reviews - When buying from secondhand retailers, check their reviews and where possible examine images carefully. Some might not advertise the condition truthfully and reviews can help avoid dealing with scammers.
- Budget - Before spending anything or starting to look at items, check you can afford them in the first place. As our data shows items continue to lose value, so can you afford it now and can you afford it not to be as valuable in several years’ time.
Methodology:
To perform the analysis of the lost value of some of the most commonly bought and resold products, we analyzed 22 items categories commonly sold on resale sites to reveal the value lost when buying new items, identifying the percentage (%) and monetary ($) value lost on average.
Using the 22 product categories, we used archive categories and product pages (from 2016, 2018, and 2020) of retail sites such as Walmart, Amazon, BestBuy, Cars.com, and Bicycles Online, using their “most popular” search filters to identify the ‘top’ products for each year.
A sample of five “most popular” retail products for each category was then collated, along with their retail prices; to provide an original retail value.
These products were then searched for on eBay (2021), checking for year and model numbers/identifiers, to collate a sample* of current and recently sold listings, recording the average price these items are selling for.
Our analysis of the data then compared the original retail price with the current re-sale prices.
*Where possible, five samples for each product category were taken. However, in some instances, this figure was reduced due to the availability of the correct models.


