The Best Cities to Save Money in the U.S.
The COVID-19 pandemic has created deep financial hardships for millions of American families—many of whom hadn’t recovered from the last recession. Amid record job losses, reduced hours, and wage cuts, the large share of U.S. workers who were already living paycheck to paycheck are now struggling even more to cover basic expenses.
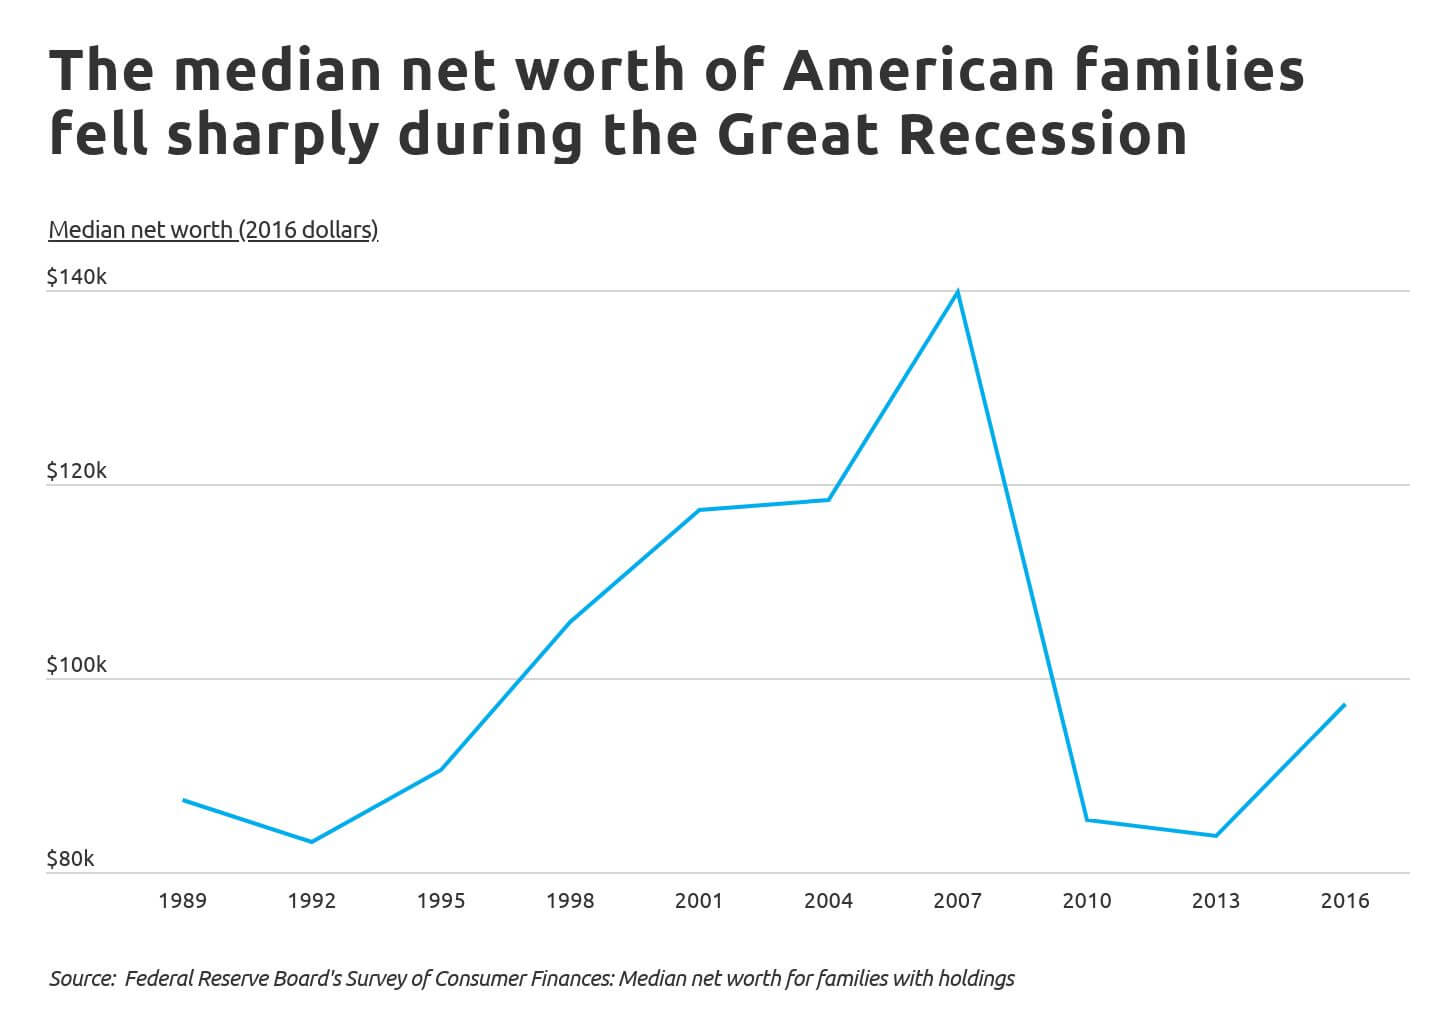
During the Great Recession, the median net worth of families fell sharply, and has yet to fully recover. After peaking in 2007 at $140,000, the median net worth for families with savings dropped to less than $84,000 in 2013. The latest data from the Federal Reserve Board’s Survey of Household Economics and Decisionmaking places the 2016 value at $97,300 - roughly equivalent to that in 1997 after adjusting for inflation.
Further, new data from the Fed's Report on the Economic Well-Being of U.S. Households shows that prior to the pandemic, less than half of Americans had enough savings to afford three months of expenses. And a staggering 37 percent of Americans reported that they would be unable to cover a $400 emergency expense without assistance.
Both having any retirement savings at all and having retirement savings that are self-reported to be “on track” increase with age. Just over 60 percent of 18- to 29-year-olds report having some form of retirement savings, but fewer than 30 percent feel that they are on track with their savings goals. Among Americans over 60, the percentages are 88 percent and 51 percent, respectively. It is no surprise that older Americans tend to have more saved than members of younger generations. But, Americans under 40 today have accumulated less wealth than their parents did when they were the same age.
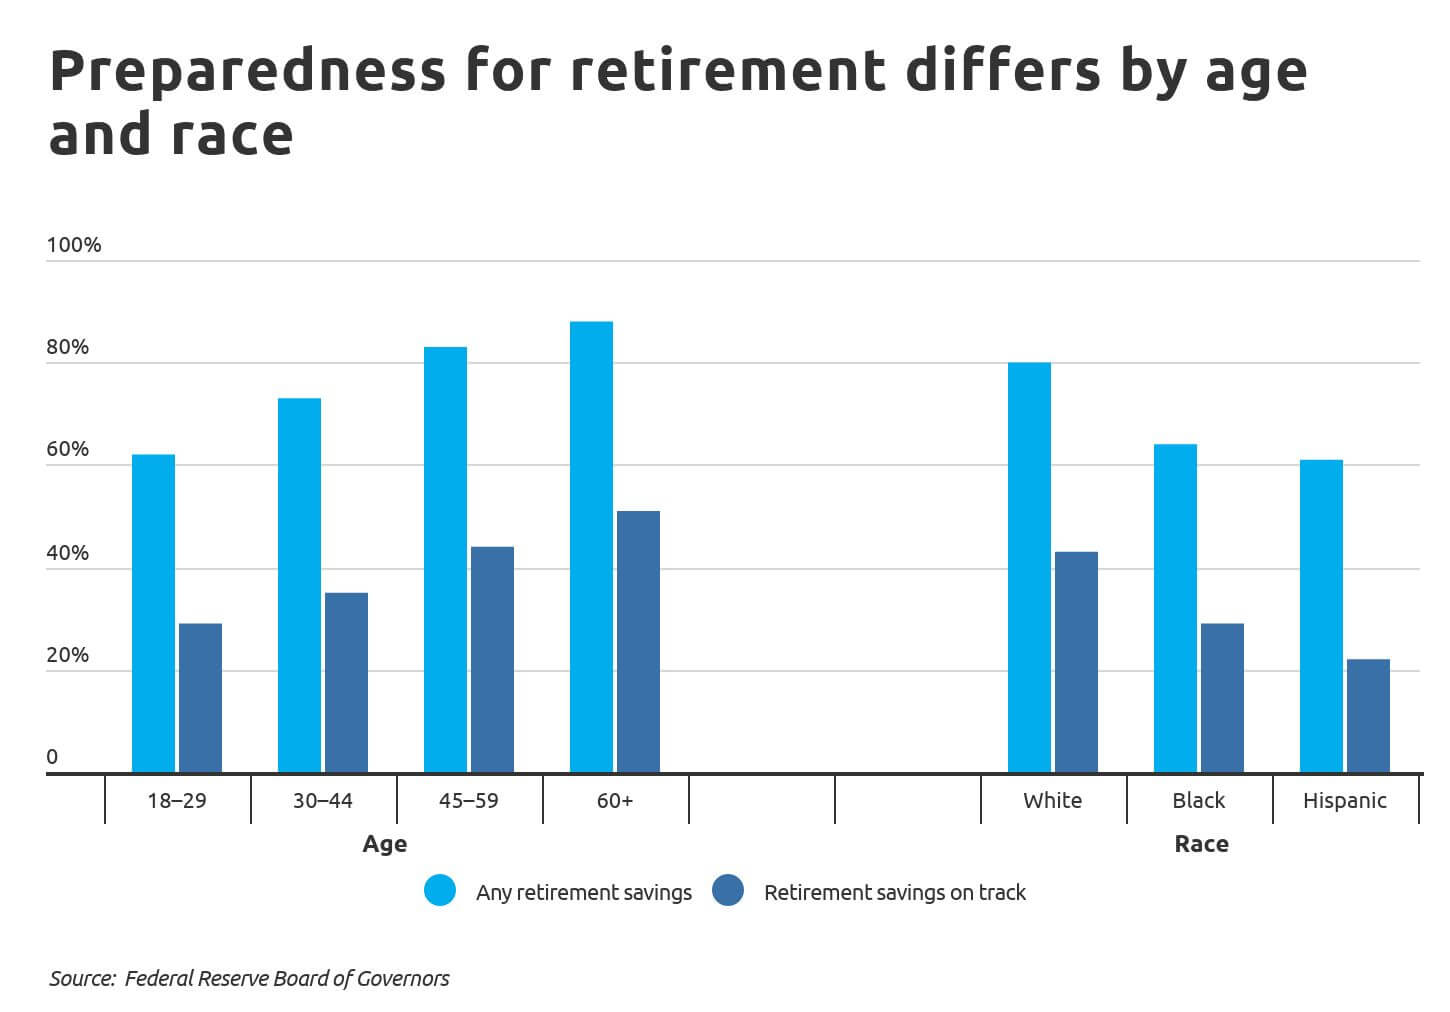
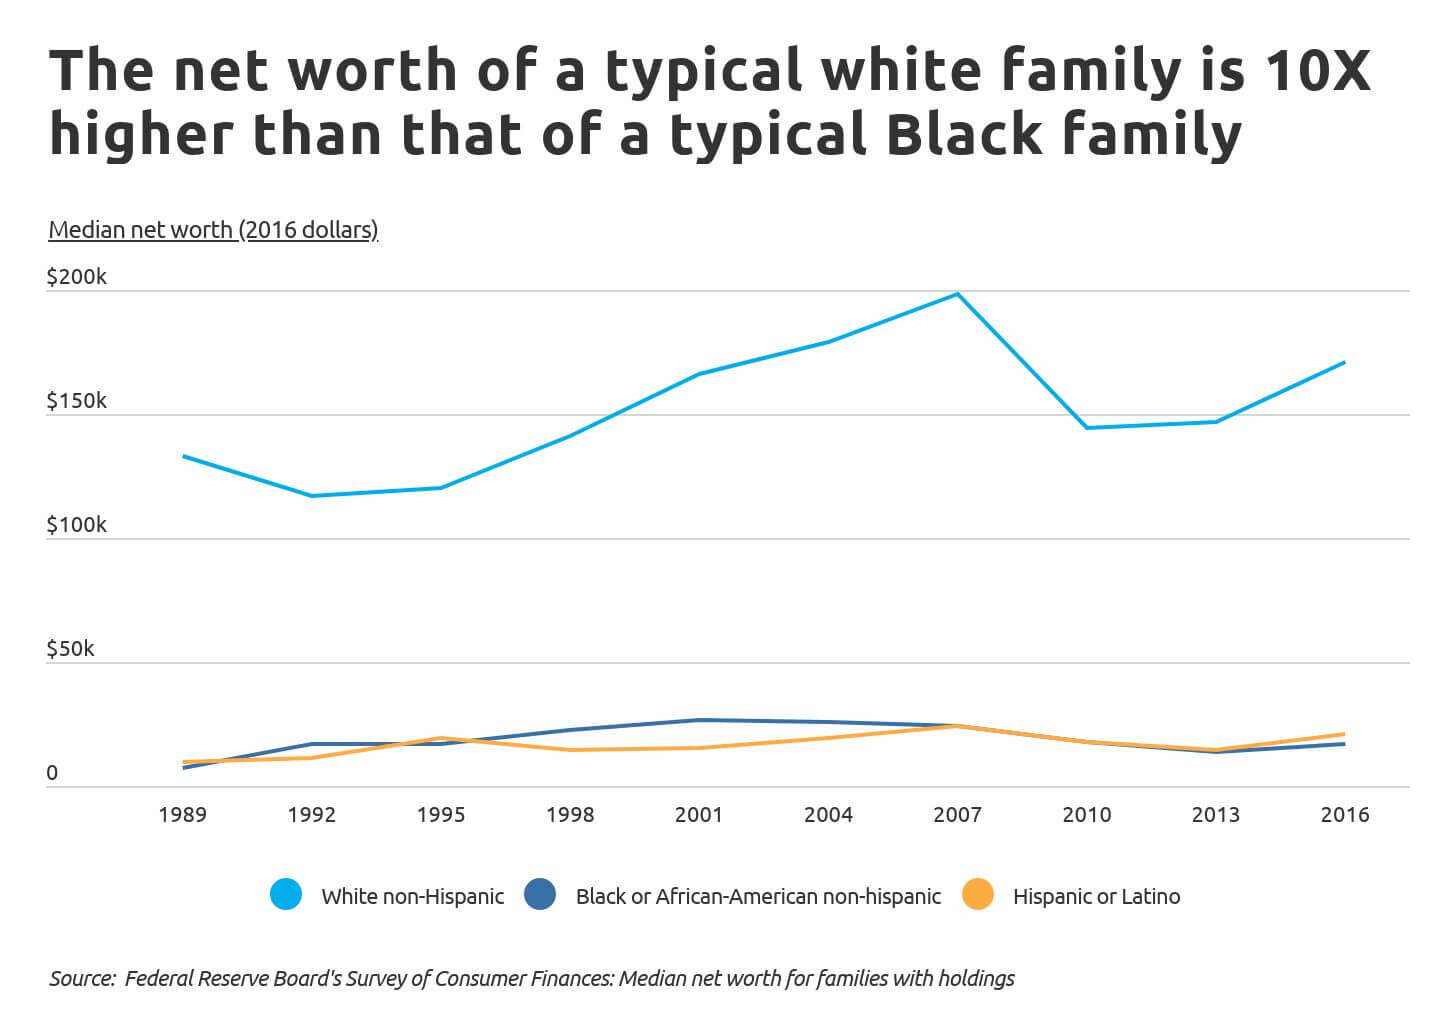
Preparedness for retirement differs not only by age group but by race and ethnicity as well. White Americans are more likely than Blacks and Hispanics to have any retirement savings, and are more likely to report that their retirement savings are on track. This difference can be partly explained by age, as U.S. racial and ethnic minorities tend to be younger than whites. However, the staggering difference in net worth between whites and minority groups is a reflection of deep inequities in opportunity that have persisted across racial lines.
RELATED: During hard financial times, it’s important to maintain good credit. Read through our comprehensive guide on what you can do to build good credit.
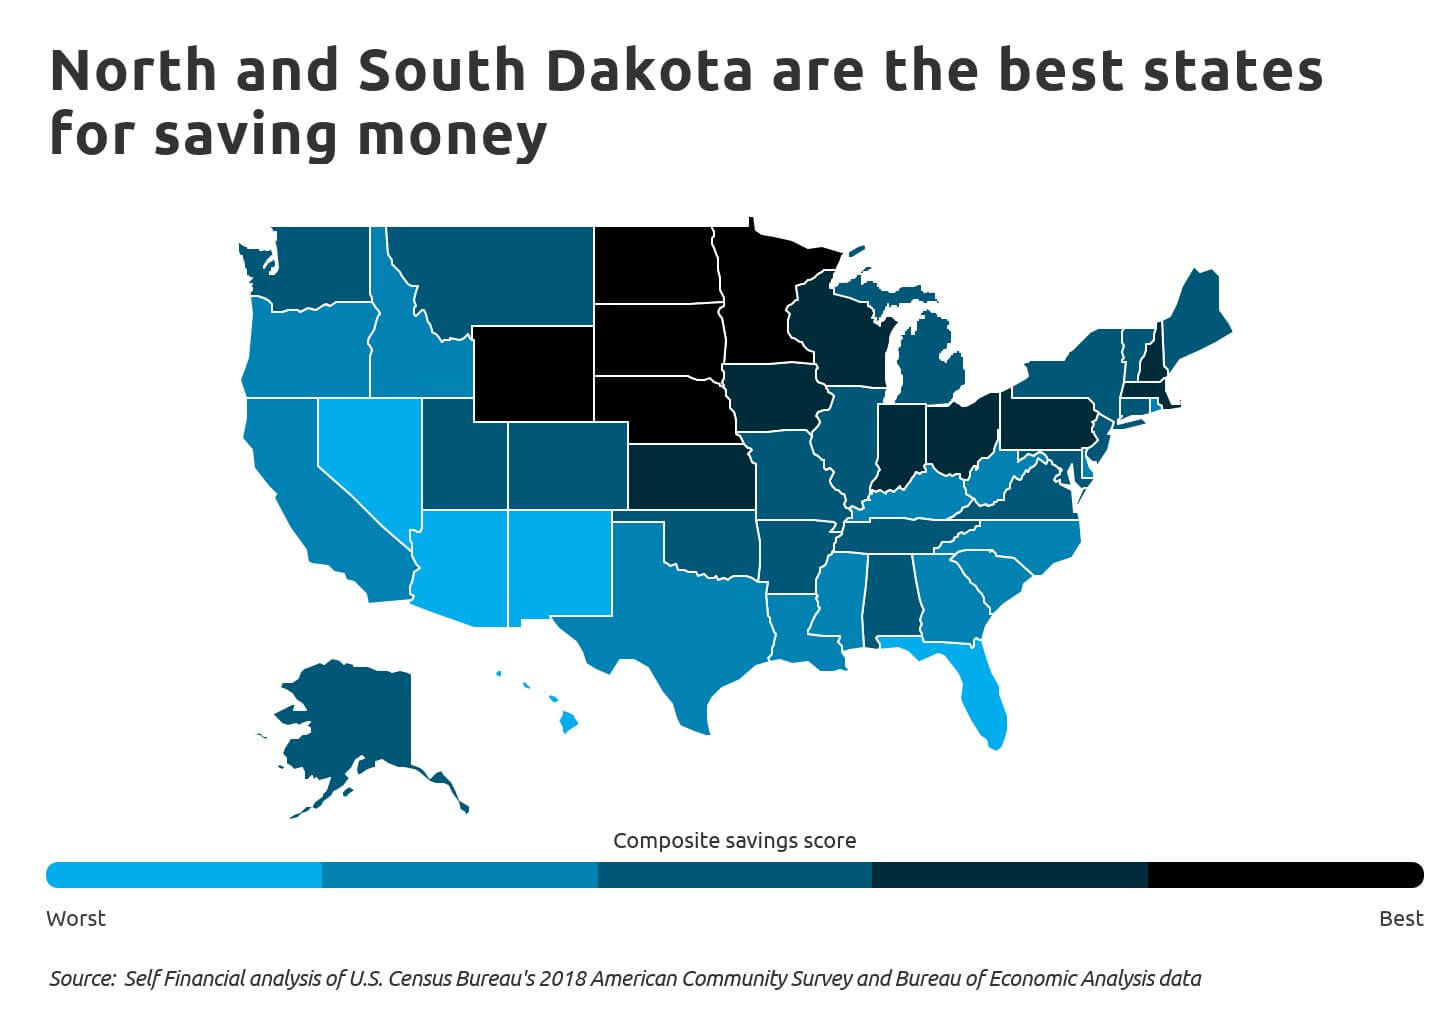
While savings behavior and ability differs across demographic groups, living in certain locations makes it far easier to save money than others. At the state level, North and South Dakota are the best states for saving money, as measured by a composite score that takes into account income, housing costs, and the unemployment rate. North and South Dakota are among a large group of Midwestern states that score highly across these metrics. Florida, Arizona, and New Mexico, on the other hand, are some of the hardest states to save money due to below-average income and above-average unemployment rates.
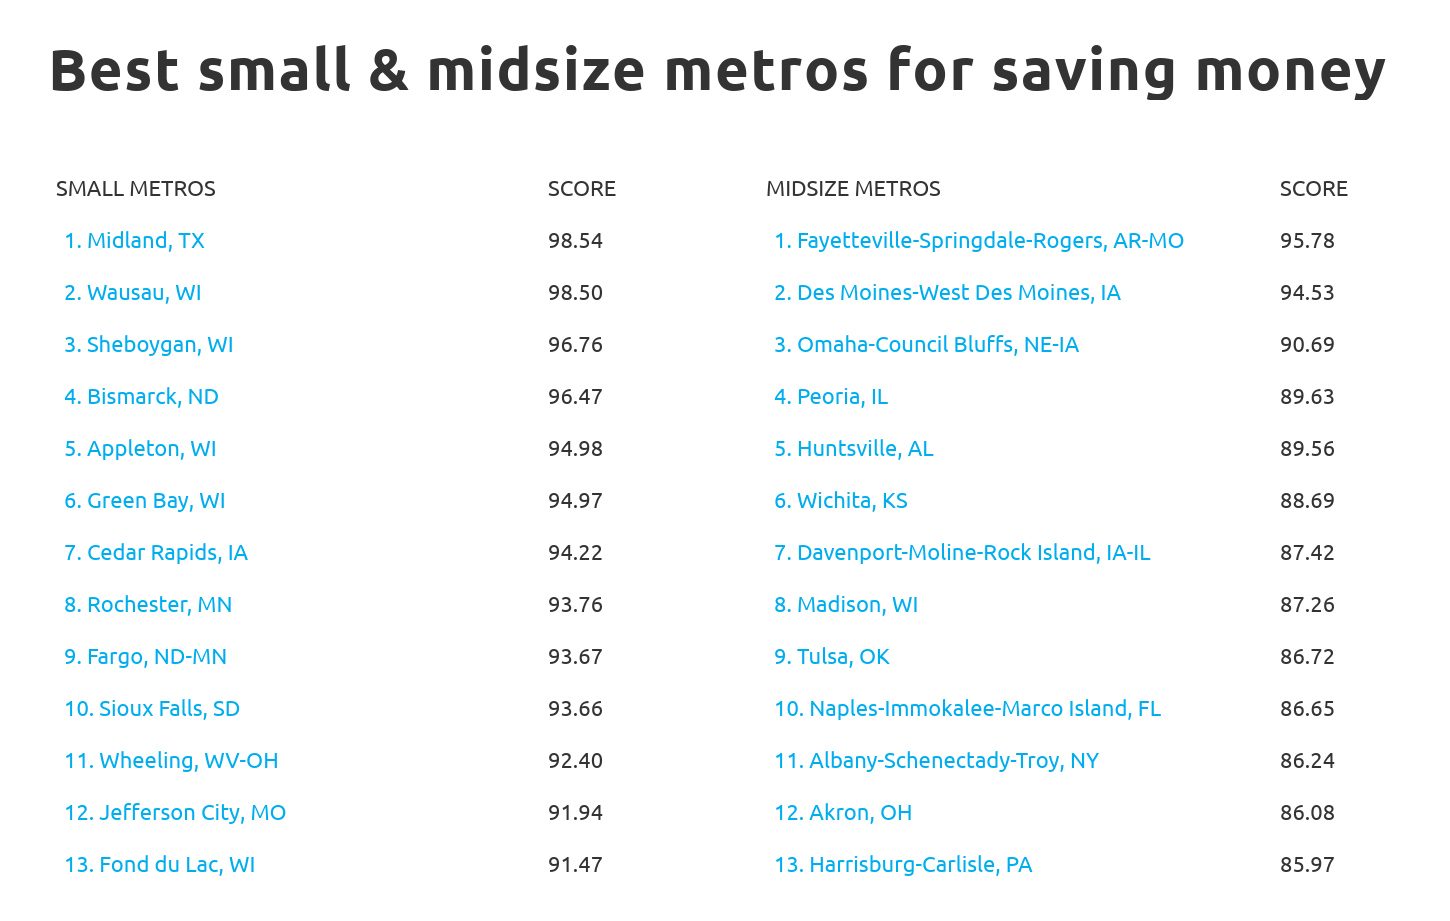
To find the best metropolitan areas for saving money, researchers at Self Financial analyzed the latest data from the U.S. Census Bureau, the Bureau of Economic Analysis, Zillow, and the Department of Housing and Urban Development. The researchers ranked metro areas according to a composite score based on the following factors: real per capita personal income, median housing costs as a percentage of median household income, and the historical unemployment rate. For additional context, researchers also calculated the median home price and the fair market rent for a two-bedroom apartment.
To improve relevance, only metropolitan areas with at least 100,000 people were included in the analysis. Additionally, metro areas were grouped into the following cohorts based on population size:
- Small metros: 100,000-349,999
- Midsize metros: 350,000-999,999
- Large metros: more than 1,000,000
Here are the best metropolitan areas for saving money.
The Best Large Metros for Saving Money

Photo Credit: Alamy Stock Photo
15. Oklahoma City, OK
- Composite score: 83.20
- Real per capita personal income: $49,904
- Median housing costs as a percentage of household income: 19.1%
- Historical unemployment rate: Below average
- Median home price: $152,392
- Fair market rent (2br): $906

Photo Credit: Alamy Stock Photo
14. Cleveland-Elyria, OH
- Composite score: 83.21
- Real per capita personal income: $55,623
- Median housing costs as a percentage of household income: 19.2%
- Historical unemployment rate: Above average
- Median home price: $155,360
- Fair market rent (2br): $849

Photo Credit: Alamy Stock Photo
13. Denver-Aurora-Lakewood, CO
- Composite score: 83.27
- Real per capita personal income: $57,109
- Median housing costs as a percentage of household income: 22.3%
- Historical unemployment rate: Significantly below average
- Median home price: $436,125
- Fair market rent (2br): $1,566
RELATED: How long it takes to build credit depends on your personal financial situation. Plan on at least six months to establish credit from scratch.
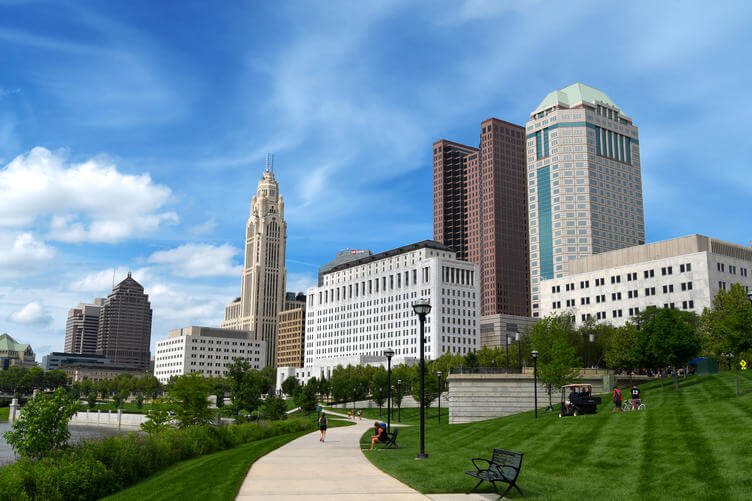
Photo Credit: Alamy Stock Photo
12. Columbus, OH
- Composite score: 83.53
- Real per capita personal income: $51,871
- Median housing costs as a percentage of household income: 19.7%
- Historical unemployment rate: Below average
- Median home price: $206,311
- Fair market rent (2br): $992

Photo Credit: Alamy Stock Photo
11. Buffalo-Cheektowaga-Niagara Falls, NY
- Composite score: 84.44
- Real per capita personal income: $49,571
- Median housing costs as a percentage of household income: 18.5%
- Historical unemployment rate: Below average
- Median home price: $170,794
- Fair market rent (2br): $843

Photo Credit: Alamy Stock Photo
10. Milwaukee-Waukesha-West Allis, WI
- Composite score: 85.19
- Real per capita personal income: $56,024
- Median housing costs as a percentage of household income: 20.2%
- Historical unemployment rate: Below average
- Median home price: $203,884
- Fair market rent (2br): $922

Photo Credit: Alamy Stock Photo
9. Nashville-Davidson--Murfreesboro--Franklin, TN
- Composite score: 86.58
- Real per capita personal income: $56,194
- Median housing costs as a percentage of household income: 20.2%
- Historical unemployment rate: Below average
- Median home price: $276,110
- Fair market rent (2br): $1,136

Photo Credit: Alamy Stock Photo
8. Indianapolis-Carmel-Anderson, IN
- Composite score: 87.41
- Real per capita personal income: $55,127
- Median housing costs as a percentage of household income: 19.1%
- Historical unemployment rate: Below average
- Median home price: $176,777
- Fair market rent (2br): $946

Photo Credit: Alamy Stock Photo
7. Kansas City, MO-KS
- Composite score: 87.48
- Real per capita personal income: $53,984
- Median housing costs as a percentage of household income: 19.2%
- Historical unemployment rate: Below average
- Median home price: $201,600
- Fair market rent (2br): $978
RELATED: If you are just establishing credit or want to improve your current score, consider using a secured credit card.

Photo Credit: Alamy Stock Photo
6. Raleigh, NC
- Composite score: 88.26
- Real per capita personal income: $53,095
- Median housing costs as a percentage of household income: 18.9%
- Historical unemployment rate: Below average
- Median home price: $281,174
- Fair market rent (2br): $1,163

Photo Credit: Alamy Stock Photo
5. St. Louis, MO-IL
- Composite score: 88.97
- Real per capita personal income: $57,243
- Median housing costs as a percentage of household income: 18.7%
- Historical unemployment rate: Below average
- Median home price: $177,745
- Fair market rent (2br): $905

Photo Credit: Alamy Stock Photo
4. Cincinnati, OH-KY-IN
- Composite score: 89.83
- Real per capita personal income: $56,678
- Median housing costs as a percentage of household income: 18.7%
- Historical unemployment rate: Below average
- Median home price: $182,045
- Fair market rent (2br): $865

Photo Credit: Alamy Stock Photo
3. Grand Rapids-Wyoming, MI
- Composite score: 89.89
- Real per capita personal income: $51,161
- Median housing costs as a percentage of household income: 17.7%
- Historical unemployment rate: Below average
- Median home price: $215,184
- Fair market rent (2br): $962

Photo Credit: Alamy Stock Photo
2. Minneapolis-St. Paul-Bloomington, MN-WI
- Composite score: 90.07
- Real per capita personal income: $56,886
- Median housing costs as a percentage of household income: 19.2%
- Historical unemployment rate: Significantly below average
- Median home price: $289,170
- Fair market rent (2br): $1,214

Photo Credit: Alamy Stock Photo
1. Pittsburgh, PA
- Composite score: 92.84
- Real per capita personal income: $58,117
- Median housing costs as a percentage of household income: 17.6%
- Historical unemployment rate: Below average
- Median home price: $156,026
- Fair market rent (2br): $890
Detailed Findings & Methodology
To determine the best places for saving money, researchers at Self Financial analyzed the latest data from the U.S. Census Bureau’s American Community Survey (ACS), the Bureau of Economic Analysis’s (BEA) Real Personal Income, Zillow’s Zillow Home Price Index (ZHVI), and the Department of Housing and Urban Development (HUD) Fair Market Rents. The researchers ranked metro areas according to a composite score based on three factors:
- Real per capita personal income (45 points)
- Median housing costs as a percentage of median household income (35 points)
- Historical unemployment rate (20 points)
Real per capita income was sourced from the BEA data and both median housing costs as a percentage of income and the historical unemployment rate come from the ACS. The historical unemployment rate was calculated as the average unemployment rate for 2016, 2017, and 2018. Researchers also obtained the median home price from Zillow and the fair market rent for a two-bedroom apartment from HUD.
The best locations for saving money are disproportionately concentrated in the Midwest. These areas tend to have high cost-of-living adjusted incomes, low housing costs relative to income, and strong job markets, as evidenced by low historical unemployment rates.
During economic downturns, having a savings cushion can make a huge difference to workers in the event of a job loss, reduced hours, or unpaid leave. Unfortunately, many Americans have little to no savings, making volatile times even more stressful. Fortunately, differences in wages, living costs, and local job markets make some cities far easier to save money in than others. Additionally, as remote work becomes an increasingly viable option for certain workers, many of these more affordable locations will begin attracting a new wave of telecommuters.
About the Author
Jeff Smith is the VP of Marketing at Self.
Editorial Policy
Our goal at Self is to provide readers with current and unbiased information on credit, financial health, and related topics. This content is based on research and other related articles from trusted sources. All content at Self is written by experienced contributors in the finance industry and reviewed by an accredited person(s).