Cities With the Biggest Increase in Rental Prices the Past Decade
Along with housing prices, rental prices have risen dramatically in the last decade. According to data from the Department of Housing and Urban Development (HUD), the average rental price for an apartment is about $1,400 per month in 2020, an increase of 32 percent in nominal dollars from 2010. Some cities have experienced much larger increases in rent, but income has not kept pace. The current economic downturn caused by the COVID-19 pandemic has made it even more difficult for many people to afford their rent payments each month.
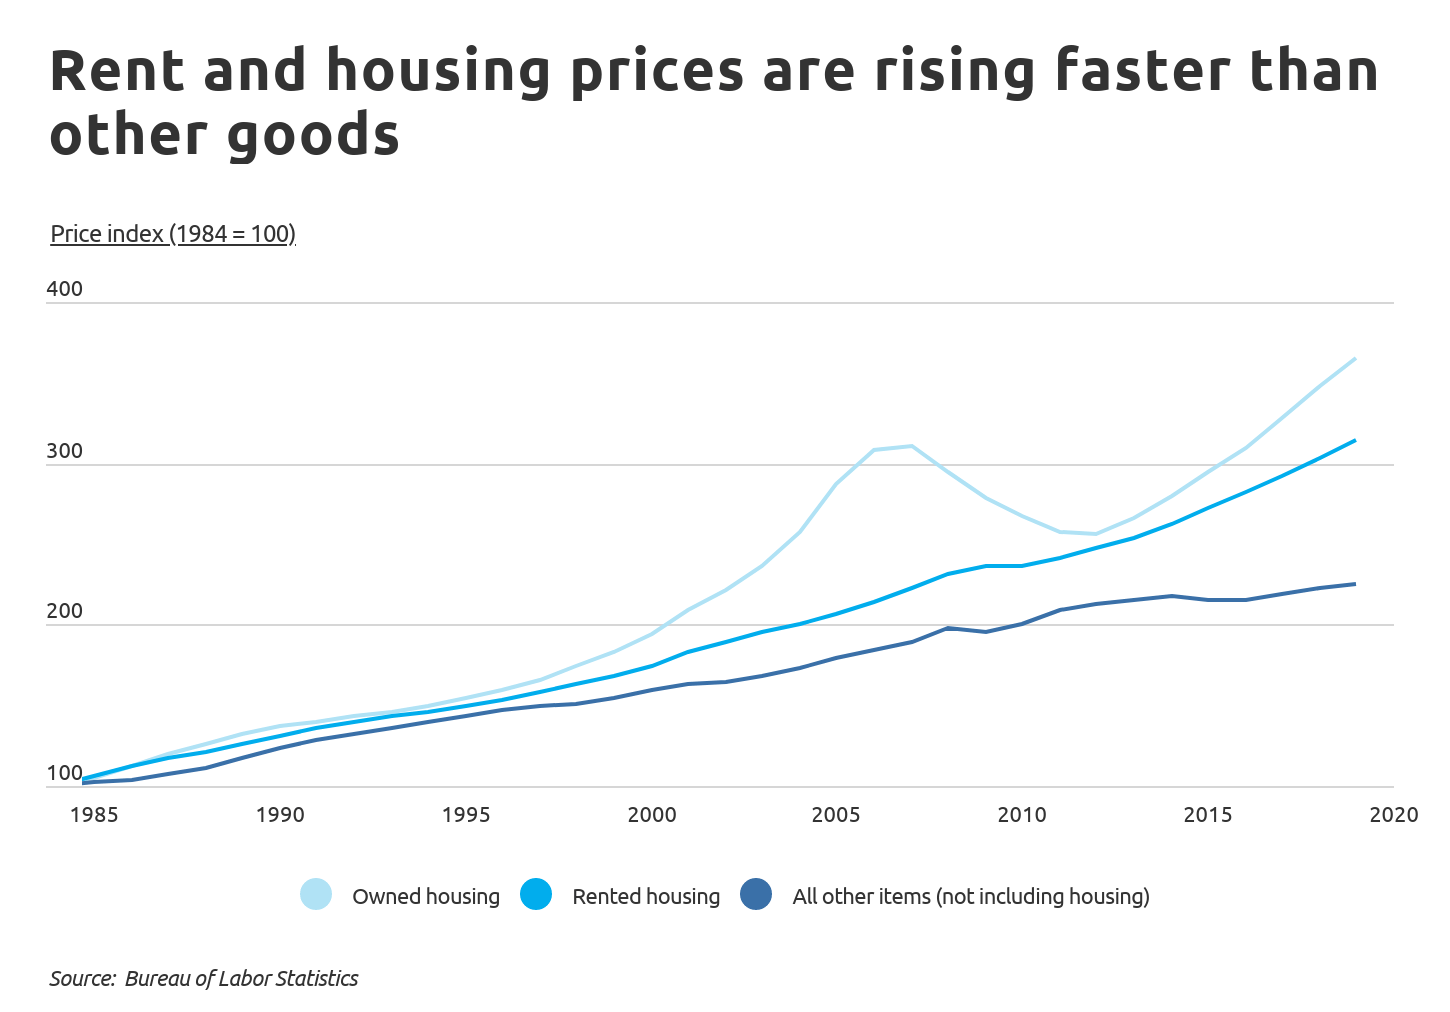
Economic data from the Bureau of Labor Statistics, which compares the relative change in prices paid by consumers for goods, services, and housing, shows that rent and housing prices are increasing at a faster rate than other items. Home sale prices have more than rebounded from the crash in 2008, while rent prices have risen steadily, showing only a slight dip during the last recession. When compared to other goods and services—including food, clothing, and transportation—both rented and owned housing are becoming relatively more expensive.
While average rent in the U.S. has increased by more than 30 percent over the last decade, some cities and states have experienced much larger increases. At the state level, the biggest increase in rental prices occured in the Pacific Northwest. Washington and Oregon recorded increases of nearly 74 and 67 percent, respectively. Conversely, rents increased more modestly in many Southern and Northeast states, such as Mississippi, Louisiana, Rhode Island, Connecticut, and Delaware. Out of all states, Nevada experienced the smallest increase in average rent since 2010, at only 4.5 percent.
TRENDING
Are you trying to get your credit score back on track? Read our detailed guide on how to build credit.

To find the metropolitan areas with the largest increase in rental prices over the past decade, researchers at Self Financial analyzed the latest data from HUD and the Census Bureau. The researchers ranked metro areas according to the average 10-year change in rent across five different rental sizes. Researchers also calculated the 10-year change in household income, the median rent for a studio, 1-bedroom, 2-bedroom, 3-bedroom, and 4-bedroom apartment, and the percentage change in rent for each type.
To improve relevance, only metropolitan areas with at least 100,000 people were included in the analysis. Additionally, metro areas were grouped into the following cohorts based on population size:
- Small metros: 100,000–349,999
- Midsize metros: 350,000–999,999
- Large metros: 1,000,000 or more
Here are the metros with the biggest increase in rental prices in the past decade.

Large Metros With the Biggest Increase in Rental Prices

Photo Credit: Alamy Stock Photo
15. Chicago-Naperville-Elgin, IL-IN-WI
- Average 10-year change in rent (all sizes): 36.8%
- 10-year change in median household income: 28.4%
- Median studio rent: $1,045 (+32.3%)
- Median 1-br rent: $1,177 (+30.3%)
- Median 2-br rent: $1,365 (+34.5%)
- Median 3-br rent: $1,734 (+39.8%)
- Median 4-br rent: $2,065 (+47.3%)

Photo Credit: Alamy Stock Photo
14. Birmingham-Hoover, AL
- Average 10-year change in rent (all sizes): 37.4%
- 10-year change in median household income: 30.1%
- Median studio rent: $875 (+40.7%)
- Median 1-br rent: $937 (+31.0%)
- Median 2-br rent: $1,073 (+34.6%)
- Median 3-br rent: $1,404 (+38.3%)
- Median 4-br rent: $1,551 (+42.4%)

Photo Credit: Alamy Stock Photo
13. Grand Rapids-Kentwood, MI
- Average 10-year change in rent (all sizes): 39.5%
- 10-year change in median household income: 39.4%
- Median studio rent: $728 (+25.1%)
- Median 1-br rent: $838 (+34.7%)
- Median 2-br rent: $1,022 (+36.4%)
- Median 3-br rent: $1,377 (+44.0%)
- Median 4-br rent: $1,574 (+57.2%)

Photo Credit: Alamy Stock Photo
12. Raleigh-Cary, NC
- Average 10-year change in rent (all sizes): 40.5%
- 10-year change in median household income: 35.0%
- Median studio rent: $1,030 (+40.1%)
- Median 1-br rent: $1,094 (+34.9%)
- Median 2-br rent: $1,245 (+38.0%)
- Median 3-br rent: $1,587 (+35.6%)
- Median 4-br rent: $2,028 (+54.0%)

Photo Credit: Alamy Stock Photo
11. Nashville-Davidson--Murfreesboro--Franklin, TN
- Average 10-year change in rent (all sizes): 42.9%
- 10-year change in median household income: 37.6%
- Median studio rent: $967 (+42.0%)
- Median 1-br rent: $1,031 (+35.7%)
- Median 2-br rent: $1,223 (+39.8%)
- Median 3-br rent: $1,598 (+38.4%)
- Median 4-br rent: $1,961 (+58.5%)

Photo Credit: Alamy Stock Photo
10. Austin-Round Rock-Georgetown, TX
- Average 10-year change in rent (all sizes): 43.0%
- 10-year change in median household income: 44.0%
- Median studio rent: $1,062 (+45.3%)
- Median 1-br rent: $1,220 (+46.5%)
- Median 2-br rent: $1,458 (+43.4%)
- Median 3-br rent: $1,896 (+37.1%)
- Median 4-br rent: $2,288 (+43.0%)
TRENDING
Can you be denied a job because of bad credit? Employers in many states may review your credit as part of a hiring process.

Photo Credit: Alamy Stock Photo
9. Minneapolis-St. Paul-Bloomington, MN-WI
- Average 10-year change in rent (all sizes): 43.4%
- 10-year change in median household income: 32.6%
- Median studio rent: $888 (+34.7%)
- Median 1-br rent: $1,050 (+36.0%)
- Median 2-br rent: $1,314 (+39.9%)
- Median 3-br rent: $1,864 (+50.0%)
- Median 4-br rent: $2,192 (+56.2%)

Photo Credit: Alamy Stock Photo
8. San Diego-Chula Vista-Carlsbad, CA
- Average 10-year change in rent (all sizes): 47.0%
- 10-year change in median household income: 39.4%
- Median studio rent: $1,490 (+44.4%)
- Median 1-br rent: $1,662 (+41.2%)
- Median 2-br rent: $2,161 (+51.2%)
- Median 3-br rent: $3,070 (+47.4%)
- Median 4-br rent: $3,794 (+51.0%)

Photo Credit: Alamy Stock Photo
7. Boston-Cambridge-Newton, MA-NH
- Average 10-year change in rent (all sizes): 52.2%
-__ 10-year change in median household income:__ 36.2% - Median studio rent: $1,655 (+46.5%)
- Median 1-br rent: $1,833 (+50.4%)
- Median 2-br rent: $2,252 (+55.8%)
- Median 3-br rent: $2,811 (+58.6%)
- Median 4-br rent: $3,073 (+49.4%)

Photo Credit: Alamy Stock Photo
6. Dallas-Fort Worth-Arlington, TX
- Average 10-year change in rent (all sizes): 52.5%
- 10-year change in median household income: 32.5%
- Median studio rent: $1,046 (+48.6%)
- Median 1-br rent: $1,195 (+52.4%)
- Median 2-br rent: $1,436 (+50.8%)
- Median 3-br rent: $1,887 (+49.4%)
- Median 4-br rent: $2,472 (+61.5%)

Photo Credit: Alamy Stock Photo
5. San Francisco-Oakland-Berkeley, CA
- Average 10-year change in rent (all sizes): 73.4%
- 10-year change in median household income: 55.4%
- Median studio rent: $1,910 (+72.1%)
- Median 1-br rent: $2,341 (+74.2%)
- Median 2-br rent: $2,887 (+76.4%)
- Median 3-br rent: $3,849 (+72.8%)
- Median 4-br rent: $4,419 (+71.6%)

Photo Credit: Alamy Stock Photo
4. Portland-Vancouver-Hillsboro, OR-WA
- Average 10-year change in rent (all sizes): 83.5%
- 10-year change in median household income: 41.3%
- Median studio rent: $1,258 (+93.2%)
- Median 1-br rent: $1,360 (+79.9%)
- Median 2-br rent: $1,577 (+81.9%)
- Median 3-br rent: $2,275 (+80.4%)
- Median 4-br rent: $2,769 (+81.9%)

Photo Credit: Alamy Stock Photo
3. Denver-Aurora-Lakewood, CO
- Average 10-year change in rent (all sizes): 83.8%
- 10-year change in median household income: 45.1%
- Median studio rent: $1,210 (+89.7%)
- Median 1-br rent: $1,367 (+87.8%)
- Median 2-br rent: $1,700 (+84.6%)
- Median 3-br rent: $2,348 (+79.5%)
- Median 4-br rent: $2,701 (+77.2%)
TRENDING
Have you heard of a credit-building credit card? Learn how a secured credit card could help rebuild your credit score.

Photo Credit: Alamy Stock Photo
2. San Jose-Sunnyvale-Santa Clara, CA
- Average 10-year change in rent (all sizes): 88.3%
- 10-year change in median household income: 54.9%
- Median studio rent: $2,221 (+90.6%)
- Median 1-br rent: $2,596 (+89.6%)
- Median 2-br rent: $3,137 (+94.1%)
- Median 3-br rent: $4,165 (+79.4%)
- Median 4-br rent: $4,780 (+87.8%)

Photo Credit: Alamy Stock Photo
1. Seattle-Tacoma-Bellevue, WA
- Average 10-year change in rent (all sizes): 91.8%
- 10-year change in median household income: 46.9%
- Median studio rent: $1,578 (+101.7%)
- Median 1-br rent: $1,700 (+89.6%)
- Median 2-br rent: $2,078 (+91.0%)
- Median 3-br rent: $2,968 (+90.5%)
- Median 4-br rent: $3,515 (+86.5%)
Detailed Findings & Methodology
The West coast claims one-third of the metros with the biggest rent increases over the past decade. The Seattle metro area had the most significant increase in rent, with average rental prices nearly doubling. Over the same time period, household income increased markedly—by nearly 47 percent—but not enough to keep pace with the rise in housing costs. This trend can also be seen in the other large metros with sharp rent increases. While the average change in rent was 57 percent for the top 15 large metros, household income increased by less than 40 percent.
Rent increases for the small and midsize metros were smaller but still sizable, averaging 51.2 percent since 2010. Household income for these metros increased by less too, going up by 39.6 percent over the past decade. With sky-high rents in many cities and many Americans without jobs, the COVID-19 pandemic has made it difficult for many people to afford their rent payments. In response, federal, state, and local government programs—such as the CARES Act—have been created to aid renters. Additionally, the CDC issued a temporary eviction moratorium that started in early September to help prevent the spread of COVID-19.
To find the metropolitan areas with the biggest increase in rental prices in the past decade, researchers at Self Financial analyzed 2010 and 2020 data from the Department of Housing and Urban Development and the U.S. Census Bureau’s 2009 and 2019 American Community Survey (ACS). The researchers ranked metro areas according to the average change in rent from 2010 to 2020. The change in rent was calculated as the average percent change in rent for a studio, 1-bedroom, 2-bedroom, 3-bedroom, and 4-bedroom apartment. In the event of a tie, the metro with the higher average rent for 2020 was ranked higher. Using ACS data, researchers also calculated the 10-year change in household income.
To improve relevance, only metropolitan areas with at least 100,000 people were included in the analysis. Additionally, metro areas were grouped into the following cohorts based on population size:
- Small metros: 100,000–349,999
- Midsize metros: 350,000–999,999
- Large metros: 1,000,000 or more
About the author
Lauren Bringle is an Accredited Financial Counselor® with Self Financial – a financial technology company with a mission to help people build credit and savings.