Cities With the Largest Increase in New Business Applications Since COVID
The COVID-19 pandemic has been particularly hard on small businesses, which are estimated to employ nearly half of all American workers. A recent Federal Reserve Bank study noted that the pandemic caused an additional 200,000 businesses to close their doors last year, with small businesses comprising the bulk of the difference.
However, it hasn’t been all bad news for the nation’s small businesses. A real-time survey of business applications conducted by the U.S. Census Bureau offers encouraging results: the increase in business shutdowns combined with changes in consumer preferences created gaps for new entrants to fill, resulting in a strong resurgence of new businesses. Between 2019 and 2020, there was a nearly 25% increase in new business applications, and that increase has held relatively steady through 2021. About one-third of current applications are considered “high-propensity applications,” or those with a high likelihood of turning into a business with payroll.

At the industry level, the increase in new business applications is being led by the retail trade sector of the economy. When comparing the number of applications from 2019 to 2020, retail trade applications increased by 59%, followed by the transportation sector which increased nearly 35%. Further, the largest percentage increases in applications were more likely to occur in those sectors already generating the highest number of applications overall. Together, this indicates the start of a robust trend for total small business creation in the economy.

While total business applications grew markedly since the beginning of the pandemic, the strongest increases appeared in the Southeast. Mississippi, Georgia and Louisiana lead the nation with application increases of over 55%. Yet, not all states fared well, as Alaska and North Dakota each saw small, single-digit percentage decreases over the same time period. At the metro level, those reporting the largest increases in new business applications are also found in the Southeast, with a handful of locations in Texas and the Midwest also ranking highly.
RELATED
Learn how you can use a secured credit card to help you improve your credit history and what you need to do to pick the right one with our comprehensive guide to secured credit cards.

The data used in this analysis is from the U.S. Census Bureau. To determine the locations with the largest increase in new business applications since COVID-19, researchers calculated the percentage change in new business applications from 2019 to 2020. In the event of a tie, the location with the higher total change in business applications from 2019 to 2020 was ranked higher.
Here are the metropolitan areas with the largest increase in new business applications since the start of the pandemic.

Large Metros With the Most New Business Applications

Photo Credit: CHARLES MORRA / Shutterstock
15. Jacksonville, FL
- Percentage change in business applications (2019-2020): +31.8%
- Total change in business applications (2019-2020): +7,537
- Total business applications in 2020: 31,202
- Total business application in 2019: 23,665
DID YOU KNOW?
Building a strong credit profile is like losing weight—you can't just flip a switch to make it better. Here are some things to know about how long it takes to improve your credit score.

Photo Credit: stellamc / Shutterstock
14. Fresno, CA
- Percentage change in business applications (2019-2020): +32.1%
- Total change in business applications (2019-2020): +1,782
- Total business applications in 2020: 7,332
- Total business application in 2019: 5,550

Photo Credit: Jon Bilous / Shutterstock
13. Riverside-San Bernardino-Ontario, CA
- Percentage change in business applications (2019-2020): +32.2%
- Total change in business applications (2019-2020): +10,944
- Total business applications in 2020: 44,887
- Total business application in 2019: 33,943

Photo Credit: Gang Liu / Shutterstock
12. Philadelphia-Camden-Wilmington, PA-NJ-DE-MD
- Percentage change in business applications (2019-2020): +33.4%
- Total change in business applications (2019-2020): +25,103
- Total business applications in 2020: 100,265
- Total business application in 2019: 75,162

Photo Credit: Sherry V Smith / Shutterstock
11. Virginia Beach-Norfolk-Newport News, VA-NC
- Percentage change in business applications (2019-2020): +35.0%
- Total change in business applications (2019-2020): +6,683
- Total business applications in 2020: 25,783
- Total business application in 2019: 19,100

Photo Credit: Sean Pavone / Shutterstock
10. Birmingham-Hoover, AL
- Percentage change in business applications (2019-2020): +35.3%
- Total change in business applications (2019-2020): +4,070
- Total business applications in 2020: 15,593
- Total business application in 2019: 11,523
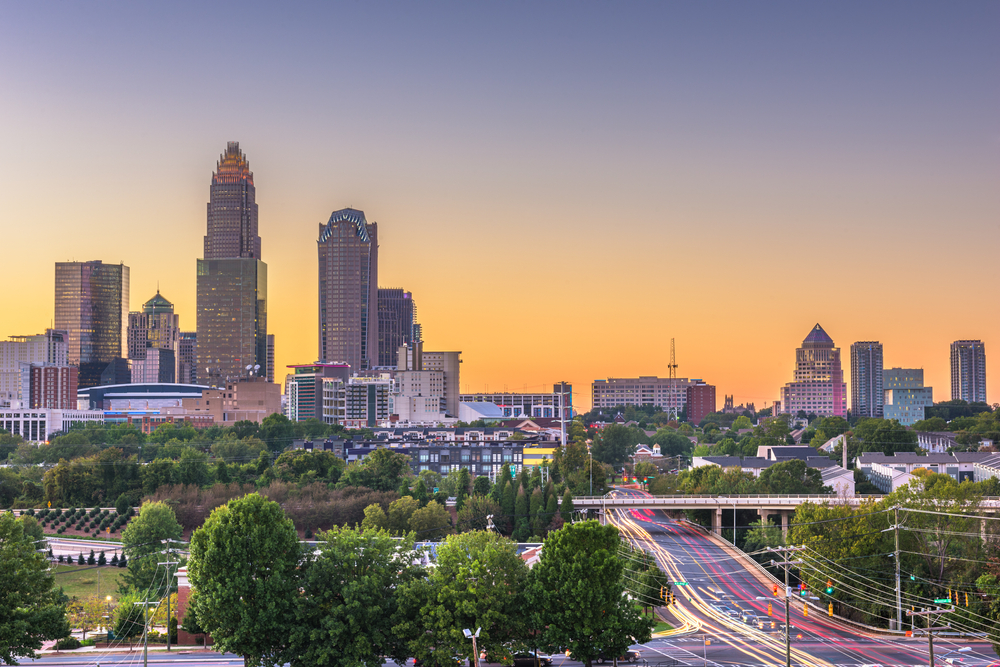
Photo Credit: Sean Pavone / Shutterstock
9. Charlotte-Concord-Gastonia, NC-SC
- Percentage change in business applications (2019-2020): +35.3%
- Total change in business applications (2019-2020): +11,879
- Total business applications in 2020: 45,487
- Total business application in 2019: 33,608

Photo Credit: nektofadeev / Shutterstock
8. Houston-The Woodlands-Sugar Land, TX
- Percentage change in business applications (2019-2020): +37.4%
- Total change in business applications (2019-2020): +32,185
- Total business applications in 2020: 118,183
- Total business application in 2019: 85,998

Photo Credit: f11photo / Shutterstock
7. Milwaukee-Waukesha, WI
- Percentage change in business applications (2019-2020): +37.6%
- Total change in business applications (2019-2020): +5,773
- Total business applications in 2020: 21,127
- Total business application in 2019: 15,354

Photo Credit: f11photo / Shutterstock
6. Detroit-Warren-Dearborn, MI
- Percentage change in business applications (2019-2020): +48.9%
- Total change in business applications (2019-2020): +26,947
- Total business applications in 2020: 82,098
- Total business application in 2019: 55,151

Photo Credit: Oleg Podzorov / Shutterstock
5. Chicago-Naperville-Elgin, IL-IN-WI
- Percentage change in business applications (2019-2020): +49.7%
- Total change in business applications (2019-2020): +51,394
- Total business applications in 2020: 154,758
- Total business application in 2019: 103,364
TRENDING
The best way to build credit is to focus on the 5 major factors that impact your credit score, like paying your bills on time, keeping your credit utilization low, and using all types of credit responsibly. Here’s more information on how to build credit.

Photo Credit: f11photo / Shutterstock
4. Cleveland-Elyria, OH
- Percentage change in business applications (2019-2020): +54.5%
- Total change in business applications (2019-2020): +11,302
- Total business applications in 2020: 32,045
- Total business application in 2019: 20,743
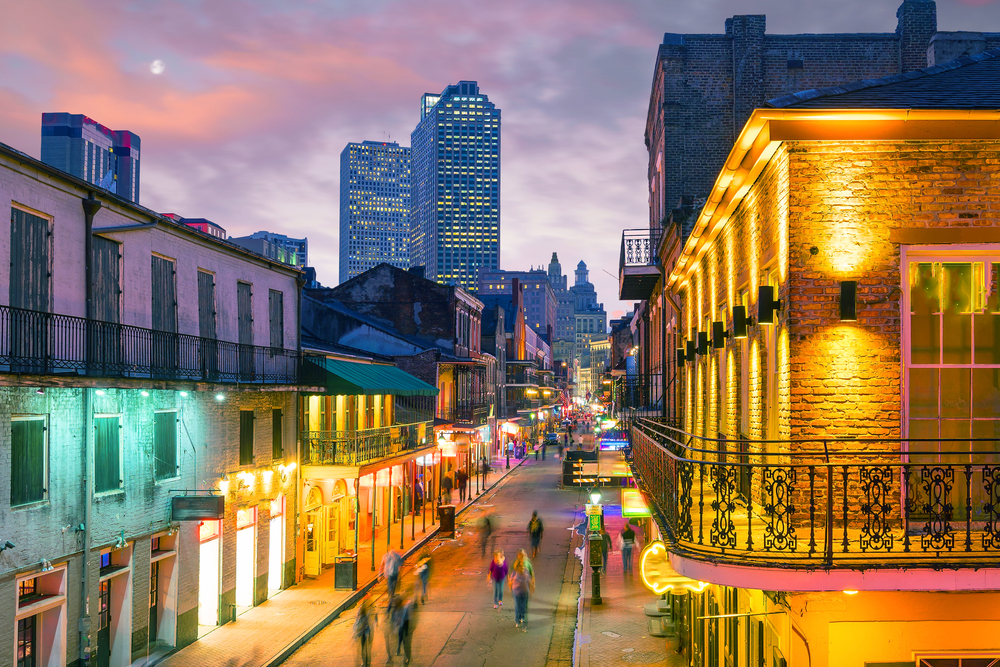
Photo Credit: f11photo / Shutterstock
3. New Orleans-Metairie, LA
- Percentage change in business applications (2019-2020): +55.6%
- Total change in business applications (2019-2020): +10,659
- Total business applications in 2020: 29,830
- Total business application in 2019: 19,171

Photo Credit: ESB Professional / Shutterstock
2. Atlanta-Sandy Springs-Alpharetta, GA
- Percentage change in business applications (2019-2020): +56.8%
- Total change in business applications (2019-2020): +73,365
- Total business applications in 2020: 202,603
- Total business application in 2019: 129,238

Photo Credit: Sean Pavone / Shutterstock
1. Memphis, TN-MS-AR
- Percentage change in business applications (2019-2020): +77.7%
- Total change in business applications (2019-2020): +11,554
- Total business applications in 2020: 26,431
- Total business application in 2019: 14,877
Detailed Findings & Methodology
The data used in this analysis is from the U.S. Census Bureau’s Business Formation Statistics. To determine the locations with the largest increase in new business applications since COVID-19, researchers calculated the percentage change in business applications from 2019 to 2020. In the event of a tie, the location with the higher total change in business applications from 2019 to 2020 was ranked higher. To improve relevance, only metropolitan areas with at least 100,000 residents were included. Additionally, metros were grouped into cohorts based on population size: small (100,000–349,999), midsize (350,000–999,999), and large (1,000,000 or more).


